Automatically Calculating Compensation Definitions(自动计算补偿定义)
除了手动为每一个目标参数-源参数对输入要减去的百分比,或者通过眼睛主观判断,用拉条手动减去补偿百分比外,用户可以让FCS Express计算所有补偿定义。如何一步一步使用自动补偿设置,请参见自动调节补偿章节。使用以下步骤开始操作:Data(数据)标签→Data Info(数据信息)→Compensations(补偿)命令,打开Compensations(补偿)导航器,使用Create a new compensation(增加一个新补偿) ![]() 按钮来增加一个心补偿。然后点击Automatic Compensation Setup(自动补偿设置)标签来进入自动设置窗口(图169)。
按钮来增加一个心补偿。然后点击Automatic Compensation Setup(自动补偿设置)标签来进入自动设置窗口(图169)。
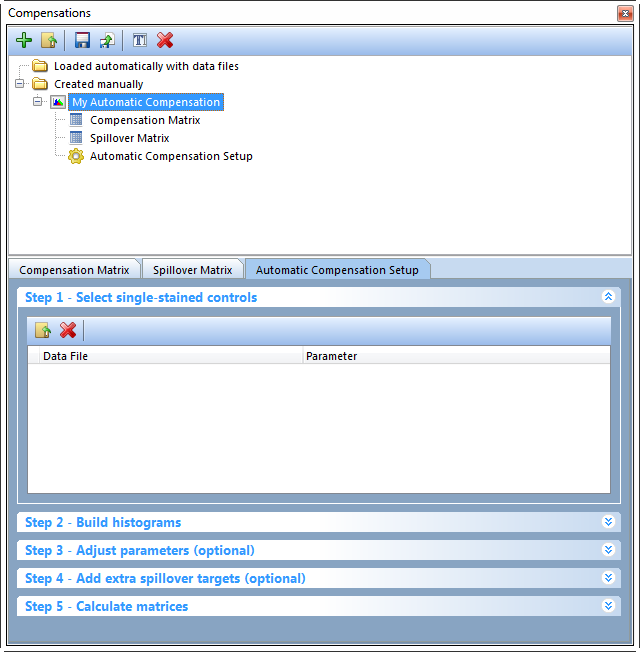
Figure 16.9 The Automatic Compensation Setup tab.
这一Automatic Compensation Setup(自动补偿设置)标签包括5个步骤,用以计算您的补偿。步骤3和步骤4是可选操作,不是一定要完成的。
| • | 步骤1-选择单染管作为对照 (图1610)。 |
要自动计算补偿定义,需要用户打算调节补偿的通道的单染管和一个空白对照管的FCS文件。空白对照管作为常用的阴性对照,通过圈门定义一个阴性细胞群。用户同样可以选择为每个要补偿的参数输入一未染色的对照或者使用在第3步(调节参数)中用户创建的门的群体定义。
| 1. | 点击Add data for auto compensation(为自动补偿增加数据)按钮 |
| 2. | 请从下拉列表中选择每个对照样本所标记的荧光的参数及universal negative的参数。 |
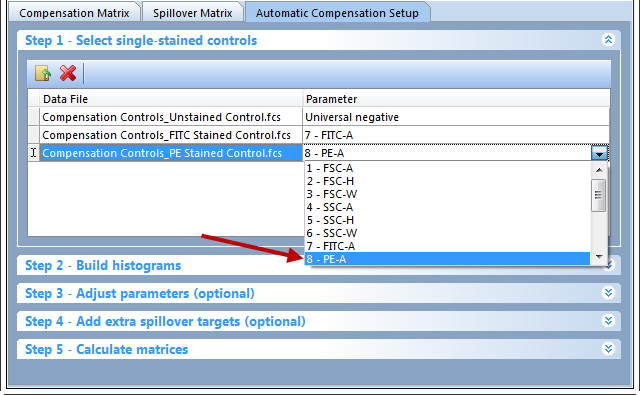
Figure 16.10 Step 1 - Select single-stained controls. Add compensation control data files and choose their respective channels from the Parameter drop down list.
| • | 第2步:构建柱状图(图1611)。 |
| 1. | 点击Build Histograms(构建柱状图)按钮。如果您在第1步选择文件或参数时有错误,此时一个提示您的错误信息将出现,同时,Build Histograms(构建柱状图)按钮将不可用,直到错误被改正。 |
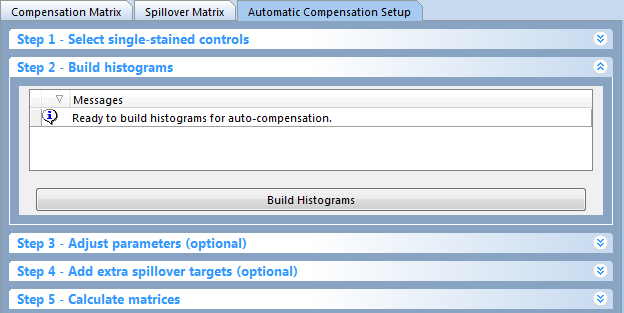
Figure 16.11 Step 2: Build Histograms
如果没有错误 ,Ready to build histograms for auto-compensation settings(准备为自动补偿设置构建柱状图)的信息将出现在Build Histograms(构建柱状图)对话框中。构建柱状图步骤将自动生成以下项目(图1612):
| • | 散点图布局的页面:一个显示SSC vs FSC 及Scatter Gate(散点图门)的页面将被创建。这一Scatter Gate(散点图门)是自动创建的,用以定义“live”细胞或者补偿对照中您感兴趣的细胞。所有的荧光门都是Scatter Gate(散点图门)的子门,这就意味着调整Scatter Gate(散点图门),其他的子门将随之更新。如果Scatter Gate(散点图门)没有显示正确的参数(例如SSC-H vs FSC-H),可使用replace gate feature(替换门特征)来将其改变。要用一个新的门来取代Scatter Gate(散点图门),方法如下: |
| . | 将X轴和Y轴都变成正确的参数。 |
| . | 在您感兴趣的细胞群中圈定一个门。 |
| . | 在Create New Gate(创建新门)中选择Replace an existing gate (取代目前的门)选项。 |
| . | 然后,从下拉菜单中选择Scatter Gate(散点图门)选项。 |
| . | 点击OK。 |
(注:这一操作在Automatic Compensation Setup(自动补偿设置)章节中也有介绍。)
| • | 展示单染对照版面的页面:为用户正调节补偿的每个通道都新建了一个页面(例如,在页面的名称出将出现"FITC-A control", "PE-A control" )。每个页面将展示一个染色的细胞群体柱状图和一个未染色的群体柱状图。根据FCS Express对峰的自动识别功能画出标记,但是位置需要用户自己调整。 |
注:只有当universal negative被选中时,未染色群体柱状图才会出现。如果universal negative未被选中,那只有一个带有两个标记(针对阳性群和阴性群)的单染绘图会出现。
| • | 门:如果针对Scatter Gate(散点图门)的新的门将被创建,那么每个单染和未染色标记都将改变。在"auto-gating" 之后,所有在Build Histograms(构建柱状图)中创建的门和标记都可以手动调节。(注:Gate View(查看门)不会被自动插入。) |
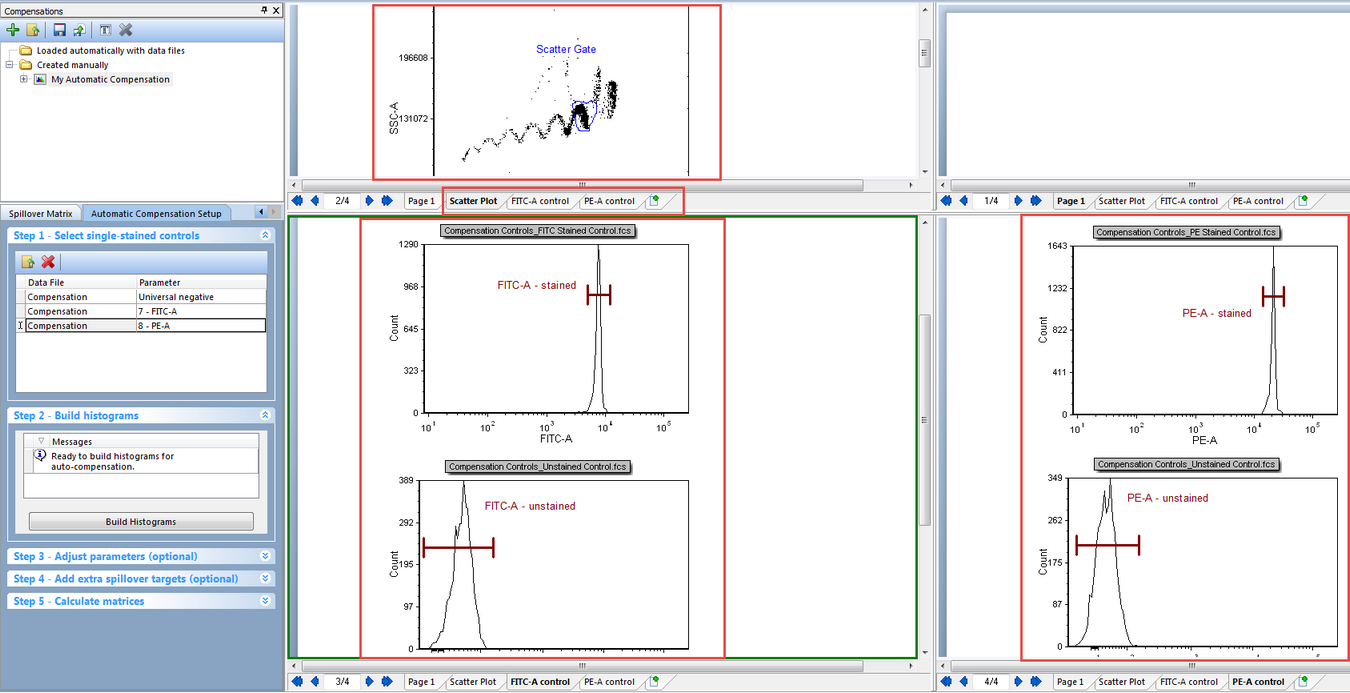
Figure 16.12 Layout after Step 2 of Autocompensation setup. Note the Scatter Plot, FITC control, and PE control pages. Also notice that a plot for SSC vs FSC has been created with a Scatter Gate automatically applied. Histograms with markers for the stained and unstained populations have also been automatically created.
这一步骤很少会用到,但是在带有某些类型的数据时很有用(例如,在一个不同的绘图上,染色和未染色的群体将在何处定义)。一旦您通过步骤1和步骤2(或者在第5步完成补偿矩阵)决定了最初的补偿参数,您可以在第3步增加Adjust parameters(调节参数)。
第3步-调节参数(可选操作)对于将进行计算补偿的群体的改善很有用。在这一部分,拖放新的绘图、文件或者门将跳过自动设置步骤,使用您选择的门和绘图进行后续操作。例如,如果Automatic Compensation Setup(自动补偿设置)没有对群体进行一个很好的评估或者您想从其他文件、门或者绘图中使用一个群体,步骤3将很有用。在Stained(染色)和Unstained(未染色)列,拖放一个绘图或者门到参数中,参数将被整体调节或改变。如果一个门被选中,那么将根据该门进行补偿定义,包括Gate View object(门视图对象)中hierarchical position(层次位置)的可视化。如果一个绘图被选中,那将根据该绘图上所有的群体进行补偿定义。如果在矩阵计算之后,您完成了一个参数的调整,您必须在第5步中点击Calculate matrices(计算矩阵)按钮,才能应用该变化。
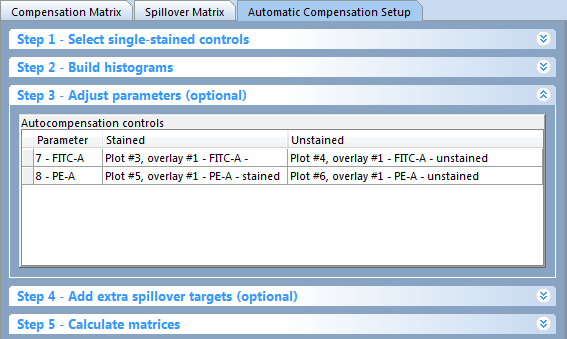
Figure 16.13 The Adjust parameters dialog displaying the currently defined parameters, plots, and gates.
对于调节参数的说明(图1614):
| 1. | 鼠标左键点击一个门或者绘图,按住不放。 |
| 2. | 将选中的门或者绘图拖拽到Autocompensation controls(自动补偿控制)表格的适当的细胞中(红色箭头)。 |
| 3. | 然后,请松开鼠标。 |
新的门和/或绘图将以名字的形式出现在Adjust parameters(调节参数)窗口的Autocompensation controls(自动补偿控制)的适当的细胞中(如下图16所示,绿色箭头)。
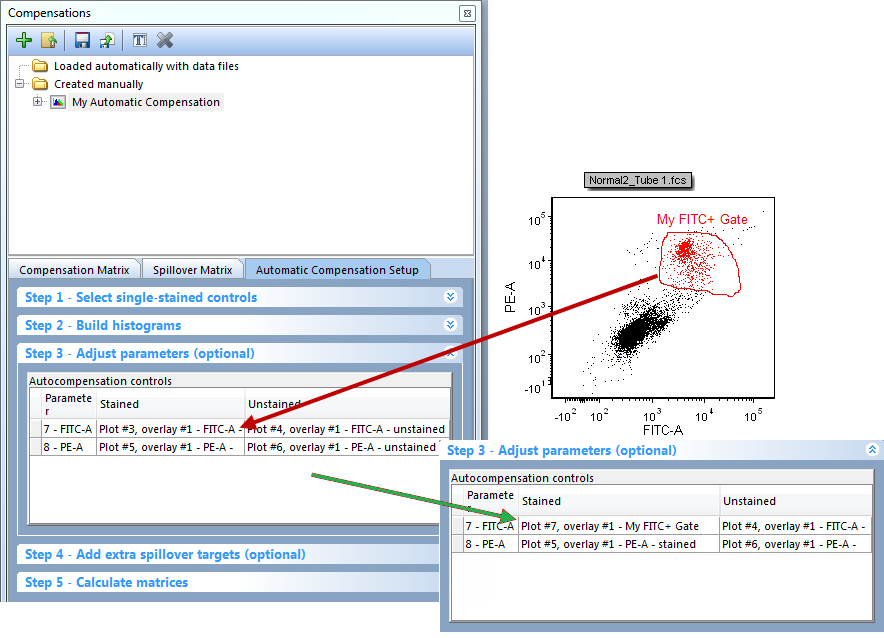
Figure 16.14 To change a parameter plot or gate drag the gate or plot onto the plot you wish to change. The plot information will then update to the newly choosen gate or plot.
增加额外的溢出目标允许用户在没有定义一个来源的情况下,增加其他的目标定义。这对于用户了解在以后的实验中,如果增加了额外的参数,溢出的数据如何很有用。如果要增加额外的溢出目标,只需点击您想要增加的额外目标的框即可。注:只有获得了数据的参数才能才能出现额外溢出目标。
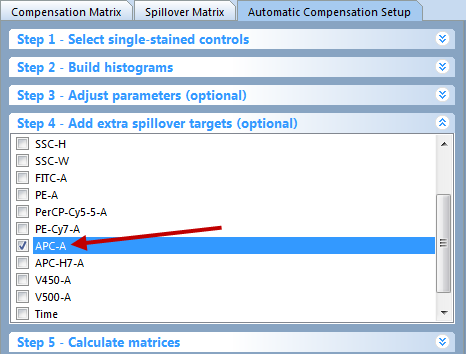
Figure 16.15 The Add extra spillover targets (optional) dialog. Checking a box will calculate the spillover for targets that have no source.
| • | 第5步:计算矩阵(图1616) |
最后一步,用户可根据Mean(平均值)或者Median(中值)来选择矩阵的计算,两者的选择根据用户自己对数据和实验的偏好。两者之中,用户只能选择自己偏好的一种。
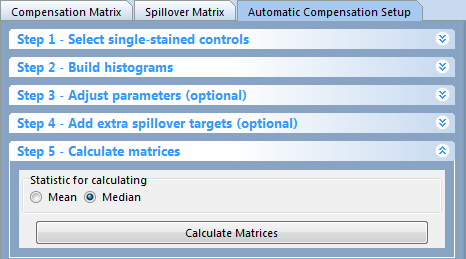
Figure 16.16 Step 5: Calculate Matrices button and choosing Mean or Median.
计算后,在补偿导航器中,您的Compensation Matrix(补偿矩阵)将出现(图1617),用户也可通过Compensation Matrix(补偿矩阵)、Spillover Matrix(溢出矩阵) 来对源-目标对进行 编辑,或者在Automatic Compensation Setup(自动补偿设置)中进行新的调整。
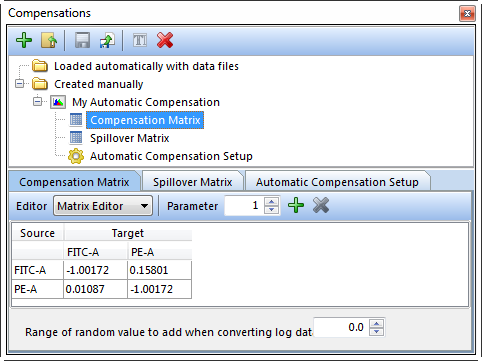
Figure 16.17 The Compensation Matrix after the Automatic Compensation Setup is complete.
自动补偿设置会和面板一起保存。要为一组不同的数据建立新的补偿矩阵,可通过Create a new compensation(增加一个新补偿) ![]() 及再次进行自动补偿设置过程轻松创建一个新补偿。
及再次进行自动补偿设置过程轻松创建一个新补偿。
我们同样建议用户使用Automatic Compensation Setup(自动补偿设置)建立补偿定义,并将其应用在不同的版面和文件;而不是反复多次建立相同的补偿定义。
对于Automatic Compensation Setup(自动补偿设置)一步一步的介绍,可在Compensation Tutorial(补偿教程)章节查看。
