插入增殖绘图
增殖绘图和FCS Express中其它绘图的创建方法一样,且regular histograms(常规柱状图)可以轻易更改为增殖绘图。
在本节中,我们将:
| • | 插入一个新的增殖绘图 |
| • | 将一柱状图更改为增殖绘图 |
| 1. | 打开教程样本数据文件夹下"Proliferation Tutorial(增殖教程)"文件夹中的"Proliferation Tutorial Fitting Proliferating Cells Section.fey"版面。 |
| 2. | 点击Proliferation Data(增殖数据)页面标签。 |
| 3. | 点击Insert(插入)→1D Plots(一维绘图)→Proliferation(增殖绘图)命令(图T20.1)。 |

Figure T20.1 Inserting a Proliferation Plot
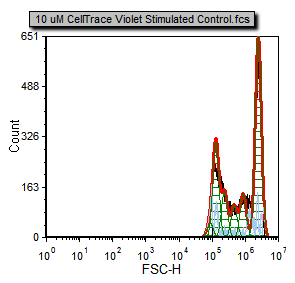
| 4. | 在当前增殖绘图的下面点击,来插入一新的增殖绘图。此时,绘图看上去应如图T20.2a所示,我们必须更改它的X轴参数和门,来正确显示数据。 |
 Figure T20.2a Proliferation plot before formatting the X Axis parameter and applying the Sytox gate. |
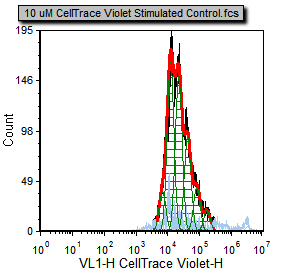
 Figure T20.2b Proliferation plot after formatting the X Axis parameter and applying the Sytox gate. |
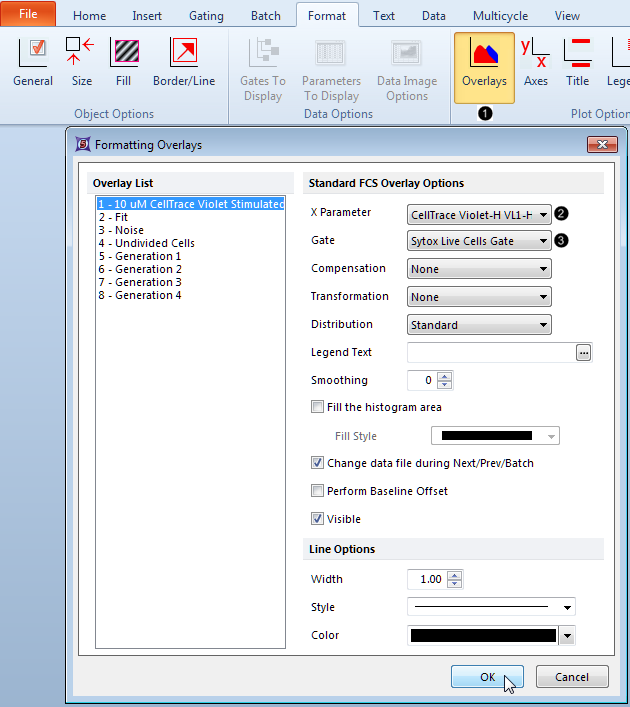
| 5. | 请从ribbon栏中选择 Format(格式)→Plot Options(绘图选项)→Overlays(数据层)(图T20.3 |

Figure T20.3 Formatting overlay options on a proliferation plot.
| 6. | 更改X轴 参数为CellTrace Violet-H(图T20.3 |
| 7. | 更改门为Sytox Live Cells Gate(Sytox活细胞门)(图T20.3 |
| 8. | 点击OK(图T20.3,鼠标光标处)。 |
现在,样本的增殖绘图呈现在页面上,也对其进行了格式化,从而显示正确的参数和门(图T20.2b)。
现在,我们将把Gating(门操作)页上的柱状图更改为增殖绘图。
| 9. | 点击程序底部的Gating(门操作)页标签,让Gating(门操作)页可视。 |
| 10. | 点击Gating(门操作)页底部的、名称为Proliferation Histogram(增殖柱状图)的柱状图标签,将其选中。 |
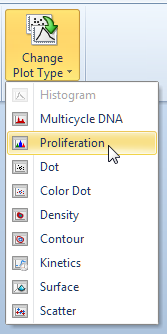
| 11. | 点击Format(格式)标签→Change(更改)→Change Plot Type(更改绘图类型)按钮。 |
| 12. | 从弹出菜单选择Proliferation(增殖)(图T20.4)。 |

Figure T20.4 Changing plot type from a histogram to a proliferation plot.
现在,此柱状图就更改为增殖柱状图了。
现在,插入增殖绘图的步骤就已经完成了。关闭版面,不要对所做更改进行保存。
在下一章节,我们将学习为使用的数据修改默认拟合。
