Applying a k-means Cluster Analysis(应用k均值聚类分析)
一旦K-Means聚类分析被执行了,结果会以一维、二维绘图的方式获得,热图和数据网格依赖于已选择的导出方式(请见之前的章节介绍。)。选择要计算的簇分配可以在已应用转换的图上作为新参数进行访问。
虽然插入数据网格时会自动显示聚类结果,为了将聚类结果作为一维图,二维图和/或热图中的参数进行访问,必须将k-means转换应用于绘图。
K-Means簇可能被用于一维图,二维图和/或热图通过如下的几种方式:
拖拽功能(图2925)
| 1. | 在转换窗口中左击并按住K-Means簇不放。 |
| 2. | 将Kmeans拖放到目标绘图。 |
| 3. | 放开鼠标键。 |
Kmeans会被应用于绘图而且绘图的标题中现在包含了文本“Kmeans clustered”,以此来表明转换已经被应用了。

Figure 29.31 Applying a k-means transformation to a plot by dragging the k-means transformation from the Transformation navigator to the plot (green arrows).
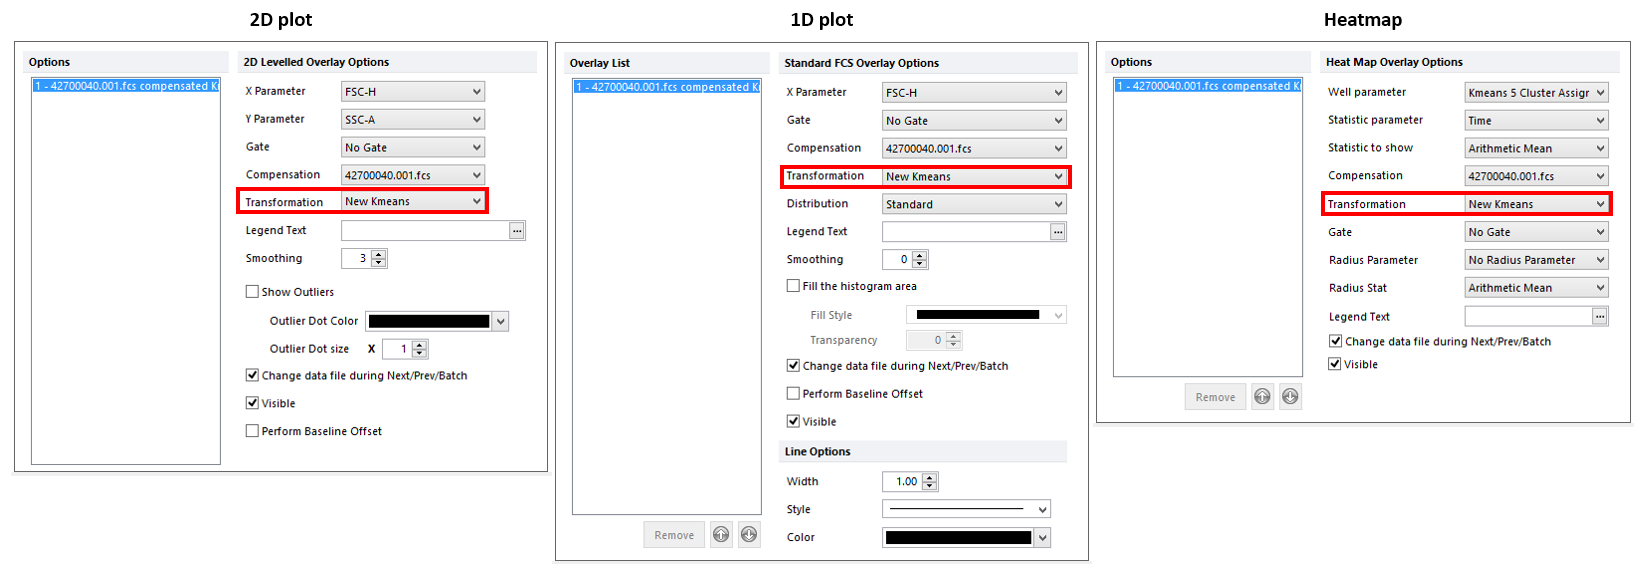
使用格式对话框(图2926)
| 1. | 进入Formatting(格式)→Overlays Dialog (叠加图层对话框) (对于一维图,二维图和/或热图)或者是Formatting(格式)→General dialog(普通对话框)(针对数据网格) |
| 2. | 从转换下拉菜单中选择Kmeans 来应用。 |
| 3. | 点击OK。 |

Figure 29.32 Applying a k-means transformation to a plot by selecting the k-means transformation from the Formatting Overlays dialog in the Transformation dropdown.
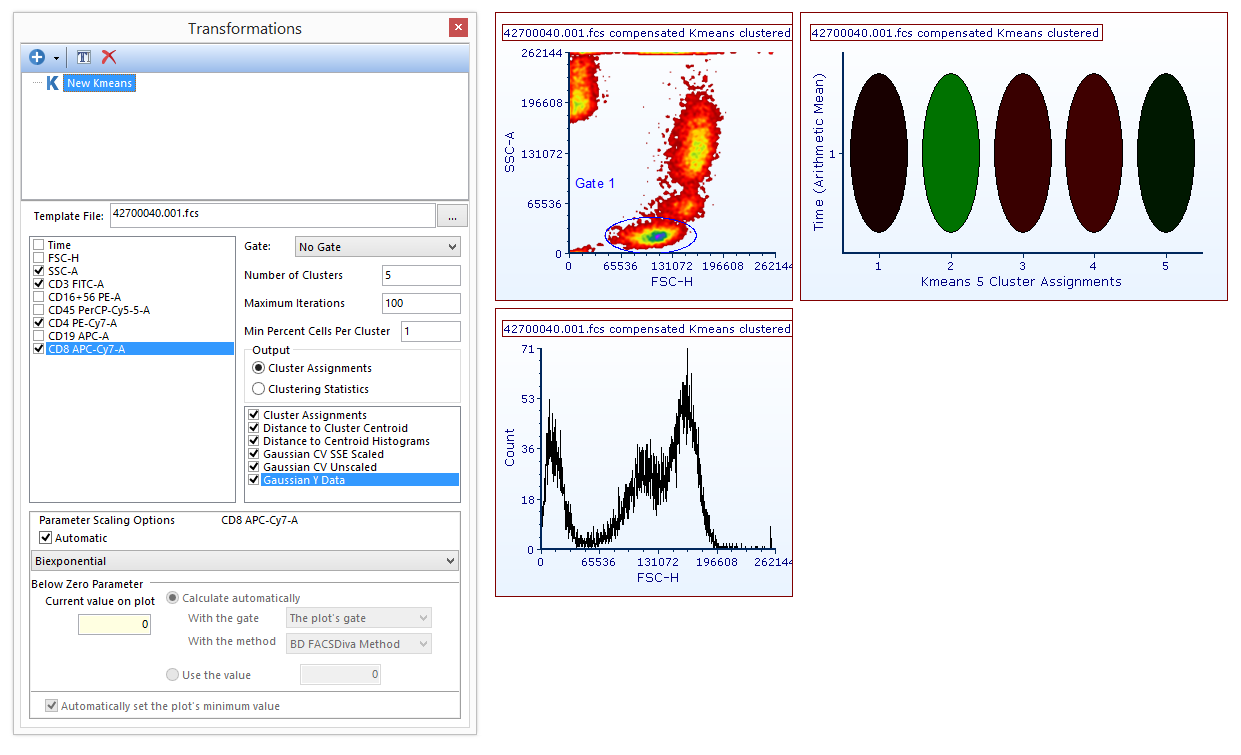
之前2种方法的结果展示如图2927所示。当K-Means簇已经被应用于绘图或者热图,后缀“Kmeans clustered”将会出现在目标标题中。

Figure 29.33 The plot title contains "Kmeans clustered" siffix when a Kmeans transformation is applied.
在接下来的章节中我们将会学习如何使用簇参数。
