Applying a k-means Clustering Analysis(应用k均值聚类分析)
一旦K-Means聚类分析被执行了,结果会以一维、二维绘图的方式获得,热图和Data Grids(数据网格)依赖于已选择的导出方式(请见操作手册中的设定一个K-Means聚类分析那个主题来获取详细的信息)。在本教程之前的部分,我们选择了Cluster Assignment(簇分配)作为导出的形式,这种到处形式允许我们创建3个群簇参数;Cluster Assignment(簇分配),Gaussian CV SSE Scaled(高斯CV SSE缩放),和Gaussian Y Data(高斯Y数据)。这些新参数 可能访问已经使用转换的绘图。
在这个教程中,我们将会应用k-means转换到一维绘图,二维绘图和热图。
请注意:尽管可以使用不同的方法将转换应用到绘图上,(这一部分请参考手册中应用一个 k-means聚类分析主题来了解更多),在本教程中,我们将使用拖放的方法。
打开本教程需要的一个分析面板:
| 1. | 选择File(文件)标签→Open(打开)。 |
| 2. | 导航到Tutorial Sample Data(教程样本数据)文件夹并且打开Applying k-means.fey(应用k-means.fey)版面,这个版面存储在k-means 教程亚文件夹。 |
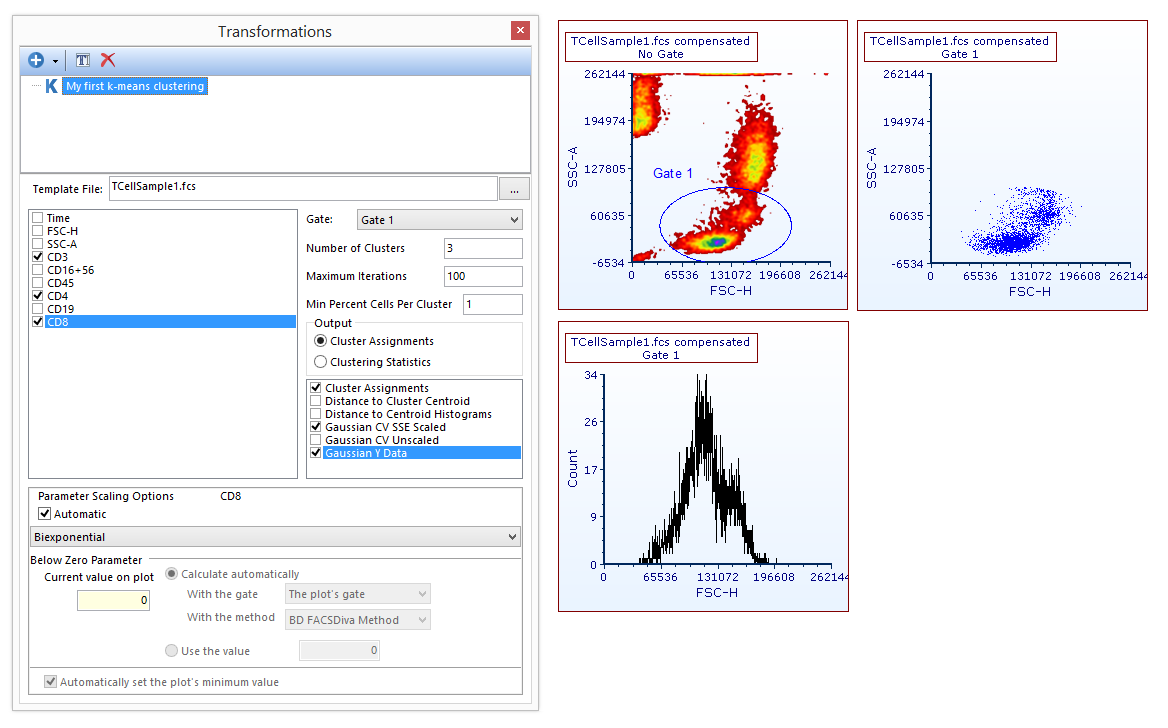
出现的版面将如图T33.6所示。一个带有我的第一个k-means聚类分析的窗口应该已经被打开了。

Figure T33.6. The Applying k-means.fey layout as it appear after opening it.
因为我们在新的聚类参数中选择了Cluster Assignment(簇分配),我们将能够使用热图展示这些簇。由此,让我们在版面中打开一个新的热图。
| 3. | 从顶栏中选择Insert(插入)→Other Plots(其它绘图)→Heat Map(热图)。 |
| 4. | 请在版面中用户想要插入热图的地方点击。 |
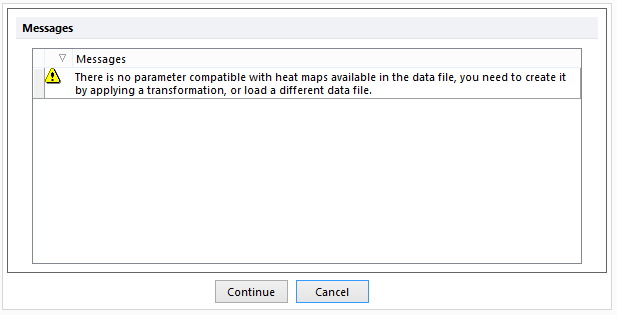
| 5. | 一个信息会出现,there is no parameter compatible with Heat Maps available...(没有与热图兼容的参数)(图T33.7)。点击Continue(继续)。 |

Figure T33.7. The message saying that not heat map compatible parameter is currently available.
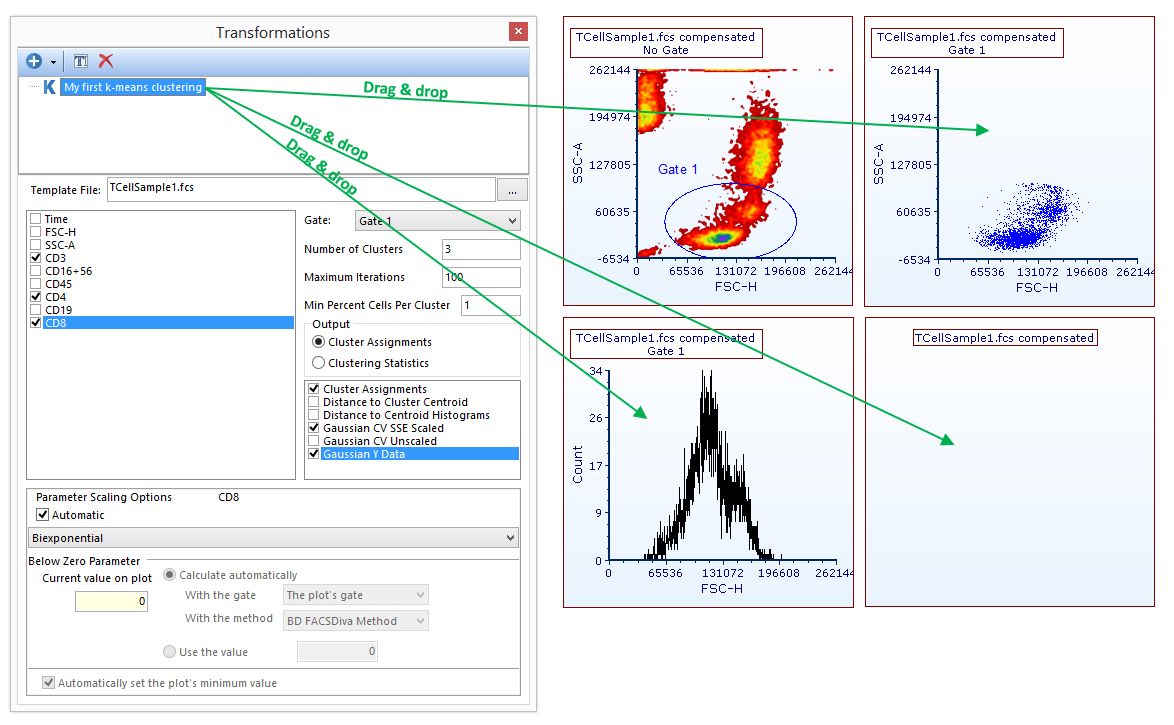
我们现在将会通过拖放的方式将版面内的所有绘图都应用k-means聚类分析 (图 T33.8)
| 6. | 在转换窗口中左击并按住K-Means簇不放。 |
| 7. | 拖拽转换窗口中的k-means转换并当它置于每一个二位绘图的顶部时松开。 |
| 8. | 重复步骤7并将转换拖拽到新创建的热图上方。 |
| 9. | 重复步骤7并将转换拖拽到一维直方图上方。 |

Figure T33.8. Use Darg&Drop to apply the k-means transformation to the objects of the layout.
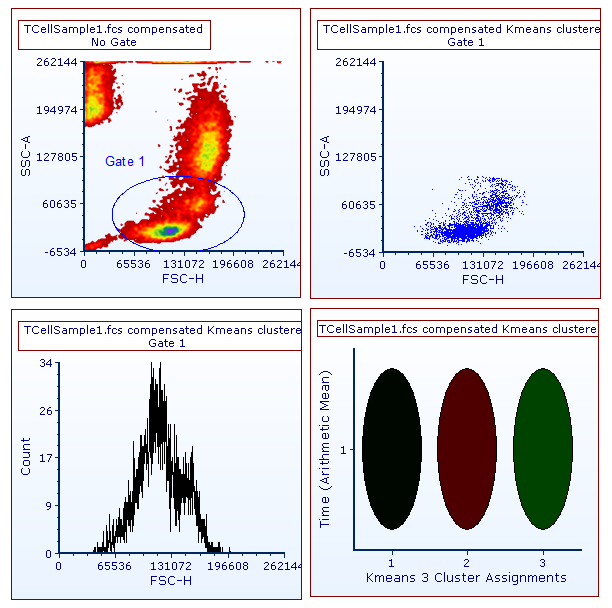
k-means现在被应用于版面上的所有目标而且绘图的标题中现在包含了文本“Kmeans clustered”,这说明了转换已经被应用了(图T33.9)

Figure T33.9. When a k-means transformation is applied to plots, the suffix "Kmeans clustered" is automatically added to the title.
请注意:当一个具备簇分配参数的k-means转换被用于热图,后者会自动显示簇分配参数,通过绘出每一个簇作为一个源的方式。当一个带有参数的k-means转换而不是簇分配 被应用于一维或者二维的绘图,簇参数能够以流式细胞仪参数的方式被获取。
在接下来的章节中我们将会学习如何使用簇参数。
