Populating Bar Plots from Custom Data Grids
It is generally more convenient to populate Bar Plots via drag-and-drop, but the following situations require use of a Custom Data Grid:
| • | Bars derived from: |
| o | Custom Tokens that cannot serve as a drag source during drag-and-drop (e.g., those not visible within a text box) |
| o | The results of Parameter Math or array formulas calculated within a Custom Data Grid, and |
Note: Bar Plots requiring these formatting elements can still be populated with bars via drag-and-drop, but accessing the Custom Data Grid is required to add them.
If a Custom Data Grid exists on the layout, an inserted Bar Plot will be automatically populated with the Custom Data within the Grid. If more than one Grid exists, select that which is intended as the data source prior to inserting the Bar Plot.
By default, the Bar Plot will plot the first two columns of the Custom Data Grid for the X- and Y-parameters, respectively.
To populate the Bar Plot with parameters other than the first two columns of the Custom Data Grid,

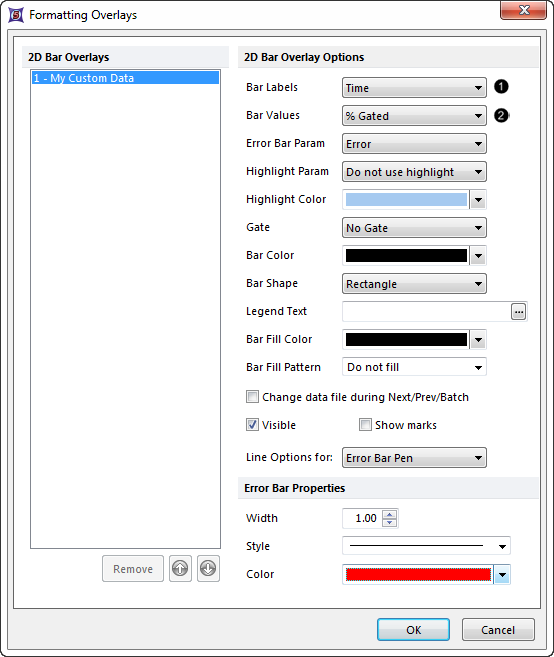
Fig. 11.30 Populating a Bar Plot from Custom Data parameters
| 2. | Choose the Custom Data Parameter (i.e., Custom Data Grid column) intended for the X-axis, from the Bar Labels drop-down menu ( |
| 3. | Choose the Custom Data Parameter (i.e., Custom Data Grid column) intended for the Y-axis, from the Bar Values drop-down menu ( |
To add an overlay to an existing Bar Plot, either
| • | Drag and drop a Custom Data Grid onto the Bar Plot, or |
| • | Drag and drop another Bar Plot onto the recipient Bar Plot, or |
| • | Right-click on the Bar Plot |
| 1. | Select Add Overlay from the pop-up menu. |
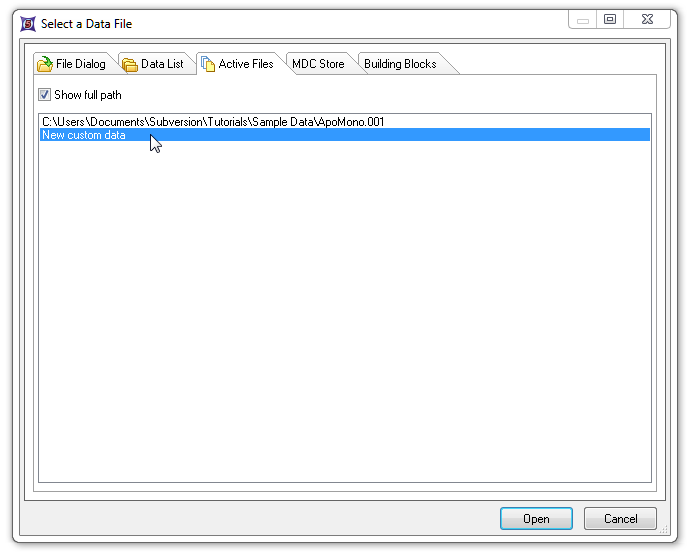
| 2. | Navigate to the data source in the Active Files tab of the Select a Data File Dialog (Figure 11.30). |
| 3. | Click Open. |
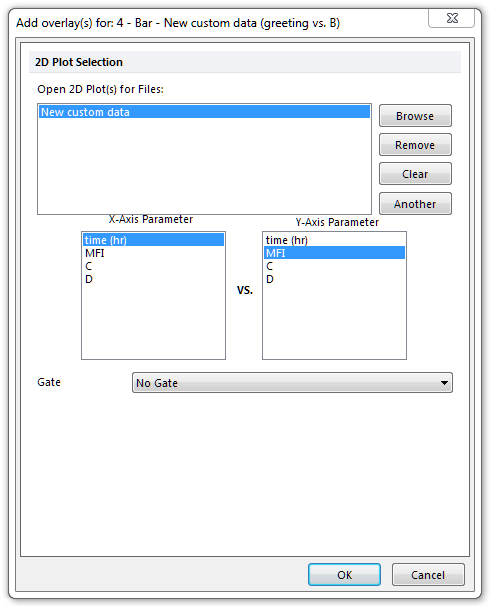
| 4. | Select the parameters for the new Overlay in the Add overlays dialog. |
| 5. | Click OK (Figure 11.31). |

Figure 11.31 Selecting Custom Data to overlay onto an existing Bar Plot

Figure 11.32 Selecting parameters to overlay onto an existing Bar Plot
See the Formatting Bar Plots section for details on how to customize colors, bar style, error bars, and more.
