Manual Regression Analysis Example
In order to perform a manual regression analysis, you will use a custom data set. To demonstrate the use of this feature, we will fill a new data set with fixed values. Normally, you would use Tokens, representing some statistic from your analysis. Defining regressions manually is simplified in FCS Express 5 with the addition of Scatter with Regression plots. We highly recommend you visit the Scatter with Regression plots chapter before proceeding with a manual fit.
In Figure 11.49, we have inserted a 2-column, 4-row custom data set (which we named Linear Regression Data), re-named the columns X and Y, and inserted some values in the cells.

Figure 11.47 Custom Data for Regression Analysis
With this data, a linear regression should yield a slope of 10 and a Y-intercept of 1.
Regression analysis is performed using Custom Tokens.
| 1. | First, create a new custom token and name it Linear Regression. |
If you right-click in the formula area of the Custom Token window and choose Insert Function, you will find a list of available regressions, each beginning with the word Perform (Figure 11.50).

Figure 11.48 Regression Functions
| 2. | Start a formula with an equals sign (=), right-click to bring up the pop-up menu, and choose Insert Function→PerformLinearFit([xValues, [yValues], [SDvalues], [fixedParameters]) (Figure 11.51). |
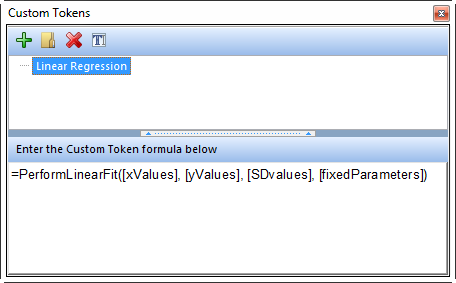
Figure 11.49 Linear Regression Formula
| 3. | In the formula, highlight xValues, right-click to bring up the pop-up menu, and choose (Figure 11.52). |
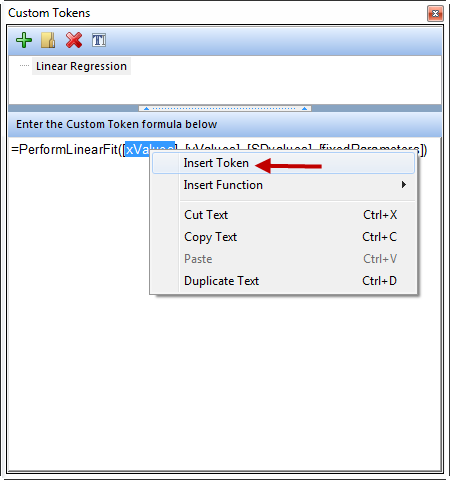
Figure 11.50 Inserting a Token into a Linear Regression Formula
An Insert a Token dialog will appear that contains a Data Parameter token (Figure 11.53).
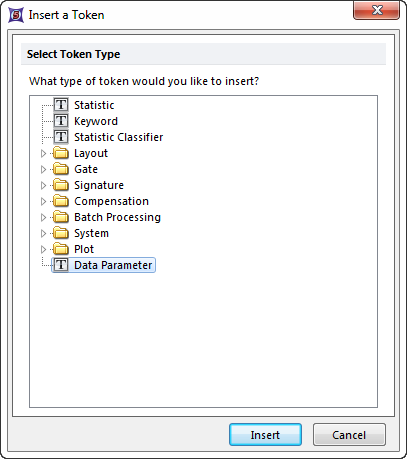
Figure 11.51 Data Parameter Token
| 4. | Select the Data Parameter token and click Insert. |
| 5. | In the Create Data Parameter dialog which appears, choose the Custom Data radio button as a Data Source, and select Linear Regression Data (Figure 11.54). |
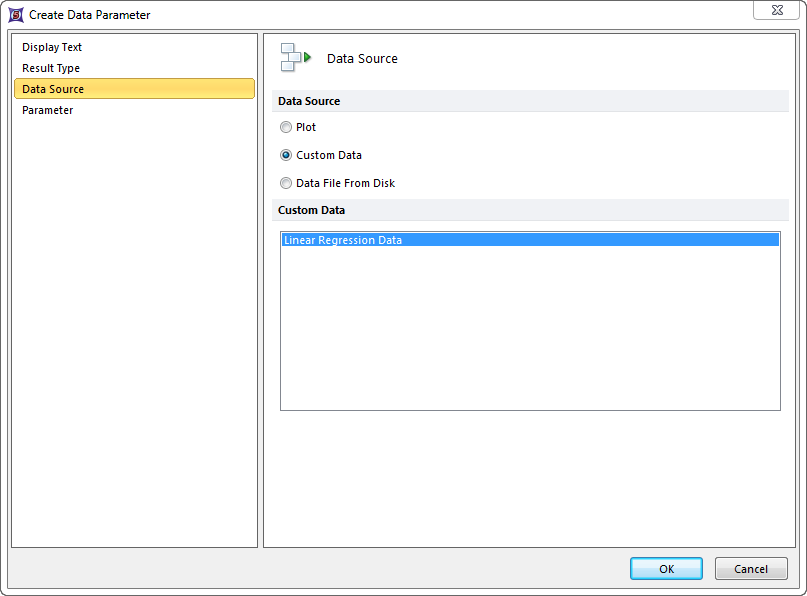
Figure 11.52 Create Data Parameter -- Data Source
| 6. | Then, go to the Parameter page and from the Parameter drop-down list, choose the data in column X (Figure 11.55). Leave Macro for the Output As drop-down selection. Choosing Data Values converts all of the data to string values which is not efficient when there is a large amount of data. |
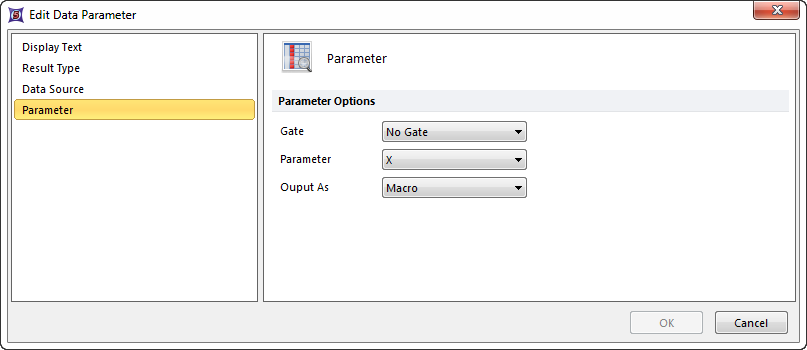
Figure 11.53 Create Data Parameter -- Parameter Page
| 7. | Repeat steps 3-6 using yValues in the formula and choosing Parameter Y. |
| 8. | Highlight SDvalues and press the Del key (leaving the area between the brackets blank. Do the same for fixedParameters (Figure 11.56). |
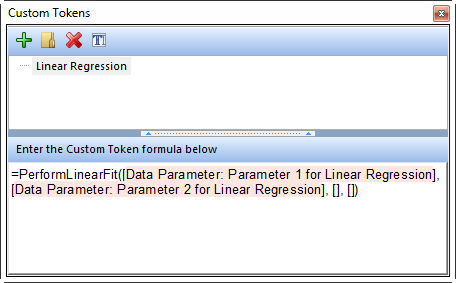
Figure 11.54 Completed Linear Regression Formula
If the measurement in your Y column was made from multiple data points and you know the standard deviation of each of the data points, you can enter a list of comma-delimited values in the SDvalues parameter of the linear regression formula. The model will weigh the points with the lower standard deviation more strongly than the points with higher SD values.
The fixed Parameters for a linear regression are m (slope) and b (Y-intercept). By leaving the parameter blank, the model will fit both of them. If you wanted to force a Y-intercept of 0, for example, you could enter b=0 in fixedParameters, and the model will fix that parameter, rather than letting it float.
| 9. | Convert both Data Parameter values in the formula to display a numeric result type (they will be highlighted in blue instead of pink). |
| 10. | Insert a Text Box onto your layout. |
| 11. | Drag the custom token Linear Regression into the text box. The m, b, and r2 (r-squared) values will be displayed (Figure 11.57). |

Figure 11.55 Linear Regression Token inserted into a Text Box
The result is a comma-delimited list of every parameter that the linear regression fit.
If you want to display just the slope of the linear regression in a text box, you create a new custom token, and:
| 12. | Use the function ExtractLinearResults([modelParameters], "m" | "b" | "r2") (Figure 11.58) as in step 2. |
| 13. | Then, select modelParameters and insert the Linear Regression token, as in step 4. |
| 14. | Delete the "b" and "r2" parameters. |
| 15. | Create a text box and insert the text: "The slope is: ". |
| 16. | Drag the Slope token into the text box (Figure 11 below). |
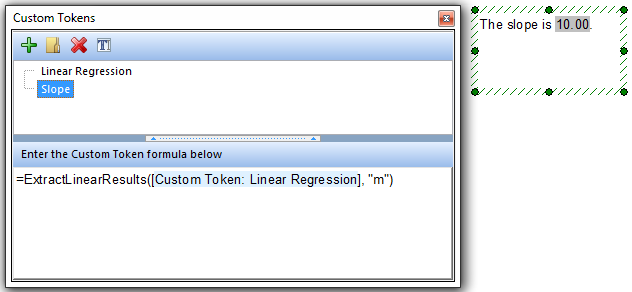
Figure 11.56 Slope Parameter of Linear Regression Analysis Inserted into a Text Box as a Token
In summary, it is a two-step process. You make one custom token for the fit, and a second custom token for the parameter that you want to use from that fit.
