Expanded Analysis with Autofit
We will now adjust the 'singlet HA' gate to include the cells with higher DNA content. Autofit in the basic version of MultiCycle will continue to perform a one cycle analysis. However, Autofit in the advanced version of MultiCycle, will mathematically decide whether to apply a one, two, or three cycle fit to the histogram data.
Please refer to Figure T19.16 for the final location of the gate.
1.Activate the 'singlet HA' gate for editing by clicking inside the gate.
2.Move the cursor to the top upper right resizing handle of the gate; you will know you are in the correct place when the cursor changes to a two-headed arrow.
3.Press and hold down the left mouse button while dragging the corner of the gate upwards.
4.Release the button when the corner of the gate is in the desired location (Figure T19.16).
5.Repeat steps 2 through 4 for the top upper left corner of the gate.
The gate should now appear similar to Figure T19.16, modified to include cells with higher content DNA, but still excluding most of the doublets.
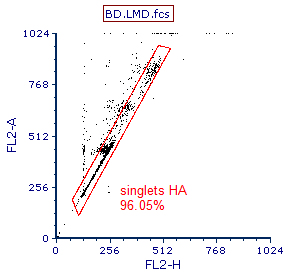
Figure T19.16 Gate Modified to Include Cells with Higher DNA Content
The Autofit function of MultiCycle updates the cell cycle analysis, as shown in Figure T19.17. Note: Figure T19.17 shows the MultiCycle analysis using the advanced version of Multicycle. The basic version of MultiCycle will continue to apply a one cycle model to the histogram.
For the rest of this tutorial we will use the advanced version of MultiCycle for the DNA analysis. However, all the formatting features of the DNA histogram and related statistics are also available in, and operate in the same way, in the basic version of MultiCycle.
Note that the DNA analysis now shows an aneuploid population, shown in blue in Figure T19.17. In fact, the MultiCycle Interpretation suggests that this is most likely a tetraploid population. Also of note is that a 2-cycle model was used. This information is shown in the Experiment Statistics window and can also be found by selecting the DNA histogram and then selecting the Multicycle tab.
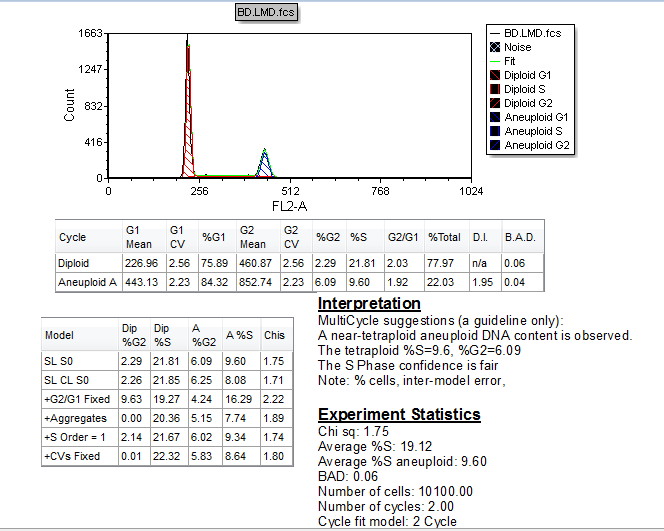
Figure T19.17 Autofit MultiCycle Analysis with Modified gate
We will now select the specific statistics we want to display in the DNA Model Summary Statistics table. There multiple ways of selecting the statistics shown in the table and these same methods can be used to select which statistics are shown for any of the DNA-associated statistics shown in the pop-up menu on Figure T19.13. For more information on formatting, please see the tutorial on Formatting Plots. First, we will close the DNA Experiment Statistics window so that we have room to expand the DNA Model Summary Statistics window.
6. Hover the mouse over the border of the DNA Experiment Statistics window.
7. Left-click when the cursor changes to a four-headed arrow; you will know it is selected for editing because it will have a red border.
8. Press Del on the keyboard or select delete from Home→Editing.
9. Left-click inside the DNA Model Summary Statistics window to select it.
10. Select the Format→Statistic Options→Statistics command.
The Formatting Stats Options dialog appears (Figure T19.18).
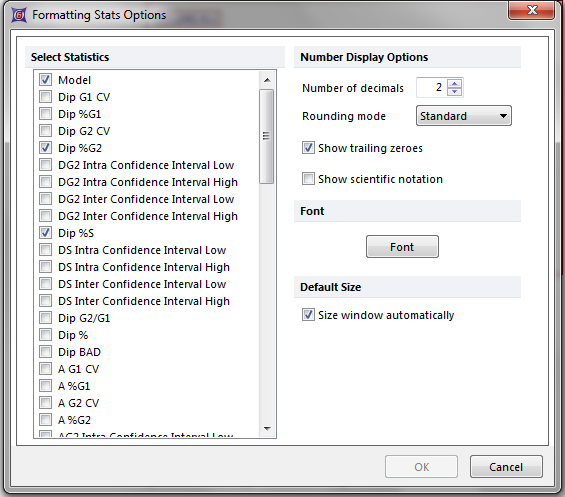
Figure T19.18 Formatting Stats Options Dialog for DNA Model Summary Statistics
11. Select the down arrow, shown by the cursor on Figure T19.18.
12. Continue to hold down the left mouse button to scroll down to the bottom of the list.
13. Click on the box next to Clump and Debris as shown in Figure T19.19.
14. Click OK.
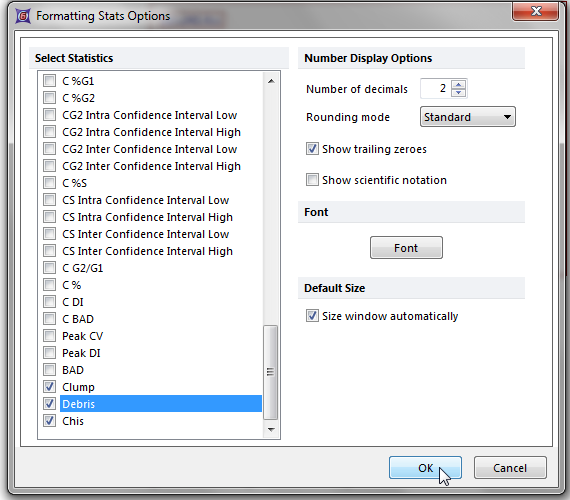
Figure T19.19 Selecting Clump and Debris from the Formatting Stats Options Dialog
The DNA Model Summary Statistics table will now update to show the selected statistics as shown in Figure T19.20.
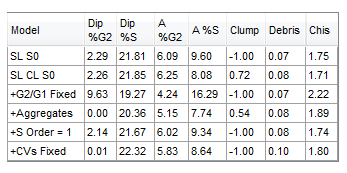
Figure T19.20 DNA Model Summary Statistics Table Updated to Show to Clump and Debris
Alternatively, you can use the DNA Model Summary Statistics associated pop-up menu to select, or De-select, the specific statistics to display.
•Right-click on the DNA Model Summary Statistics window to bring the associated pop-up menu.
The DNA Model Summary Statistics pop-up menu appears (Figure T19.21).
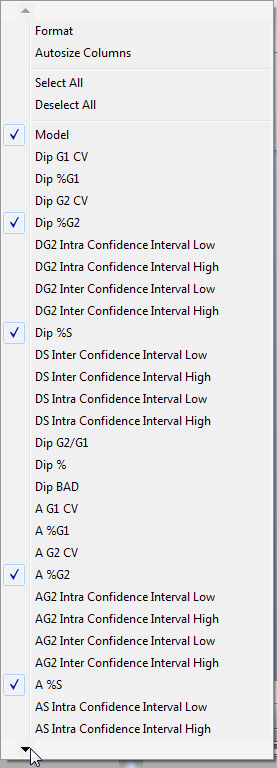
Figure T19.21 DNA Model Summary Statistics Pop-up Menu
•Select the arrow in the lower left corner of the menu to scroll down, indicated by the cursor in Figure T19.21.
•Continue to hold down the left mouse button until the menu scrolls all the way down (Figure T19.22).
•Left-click next to Clump, as indicated by the cursor on Figure T19.22, to de-select the item.
The pop-up menu will now close and the DNA Model Summary Statistics table will update to reflect the removal of the item Clump.
•Repeat the above steps to de-select Debris, located under Clump in Figure T19.22.
The pop-up menu will now close and the DNA Model Summary Statistics table will update to reflect the removal of the item Debris.
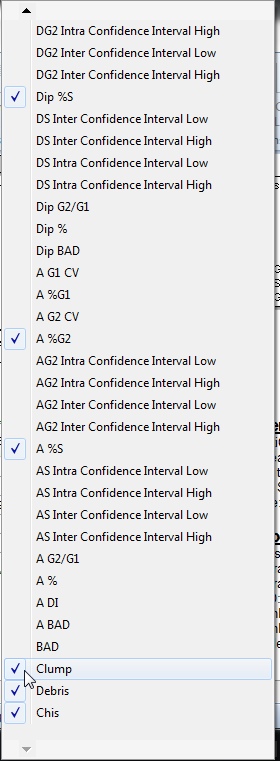
Figure T19.22 Deselecting Clump from the DNA Model Summary Statistics Pop-up Menu
You can select different DNA cell cycle models in the Multicycle→Model to Display group, and the DNA cell cycle statistics window will update to reflect the model selected. Try selecting different models from the Multicycle tab using Autofit and observe how the results change in the DNA cell cycle statistics window. When using the full version of MultiCycle, the histogram display will also update to reflect the fit to the model selected. The different models vary by the complexity of the model (applying constraints, or not, on the CV or G2/G1 mean ratio) and the inclusion of software aggregate compensation. For more information on the different models refer to the MultiCycle documentation.
A quick visual examination of the DNA Model is often useful. However, the model with the lowest Chis (Chi-square) value is usually the best fit, shown circled in red in Figure T19.23. In this case Model 2 (SL CL S0) has the lowest Chis; however, two other models have very similar low Chis values.
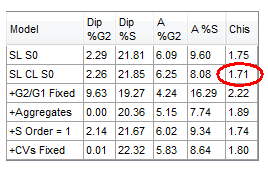
Figure T19.23 DNA Cell Cycle Model with the Lowest Chis (Chi-square) Value
In the next section, we will format a DNA histogram.
