Working with tSNE transformations
Once a tSNE transformation is applied to a plot, tSNE parameters can be accessed by clicking on the axis label of the plot Figure 9.148. Gates may be created on any combination of standard or tSNE parameters on any plot type to specifically select the events within one or more tSNE clusters. Jump to Gating tSNE transformed data.

Figure 9.147 tSNE parameters can be accesses as standard parameters.
While any plot type can display tSNE based parameters, Density and Contour plots have a unique overlay option called Color Based on (Figure 9.149) that allows for the heat mapping of a density plot to be based on the heat of a parameter in the data set. For instance, for a particular data set in which you visualize tSNE-X and tSNE-Y parameters in two plots, the Color Based on option may be set to FITC and PE on the two plots to quickly compare the intensity of expression of the FITC and PE-tagged probes within different tSNE islands/continents.
The Color Based on option is accessed via either:
•The Formatting→Overlays category of Density. The Color Based on dropdown menu will allow you to choose from Count or any available parameter for the data set to display as the Density or Contour map on the plot.
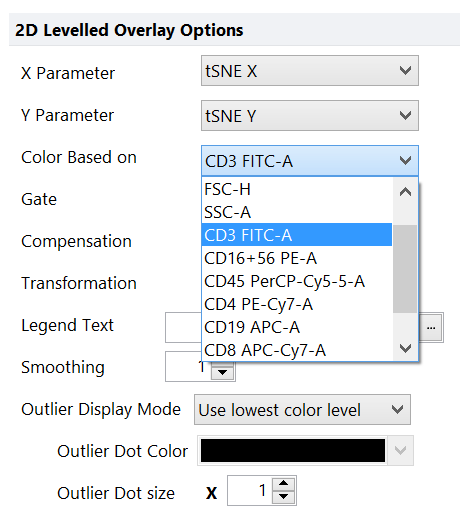
Figure 9.148 The Color based on option in the formatting>overlays category of density plots allows you to choose a parameter that will be used to display a density or contour map on tSNE X and tSNE Y transformed parameters.
•The Legend title, when the plot Legend is visible (via the dropdown menus shown in the figures below).
For tSNE transformed data sets it is useful to display tSNE X and tSNE Y parameters on the X- and Y-axes, respectively, and visualize each additional target parameter as a Color Based on selection. In the examples below the same tSNE transformation for an analysis is shown in three different display types with each plot using the Color Based on parameter indicated in the Legend of the plot. The top example shows Density plots with the Flame Color Level, the middle example shows Contour plots with outliers enabled, while the bottom plot shows Density plots with the Green-Black-Red Color Level with a Style of Mean +/- SD and Standard Deviations set to 2.00.
Using the Color by All Parameters Multi plot tool in FCS Express will autogenerate a grouped array of new plots with the same parameters as the source plot (i.e., tSNE-X vs. -Y is recommended) when the source plot is a Density or Contour plot. By setting the source plot to display tSNE-X and tSNE-Y parameters, the resulting target plots will quickly visualize the heat mapping for any number of selected parameters, so this is often the most efficient way to see the results of a highly multiparametric dataset. The parameter for Color Based On can be shown in the plot Legend.
Note that there are a number of options in FCS Express that may be changed to display tSNE-transformed data in unique ways and seemingly unlimited combinations. The following list of formatting options may be useful for reviewing and preparing data visualizations:
Please note that reducing Smoothing to 0 or 1 on plot overlays or reducing the Plot Resolution may significantly enhance your plot visualizations, especially for plots with a low or modest number of events.
•Overlays - To choose the Color Based On parameter and to show or hide outliers and outlier coloring.
•Color Levels - To choose the overall color scheme and color level properties for Density and Contour Plots.
•Specific Options - To choose the resolution to display plots at and the select Shade Based on Density if desired.
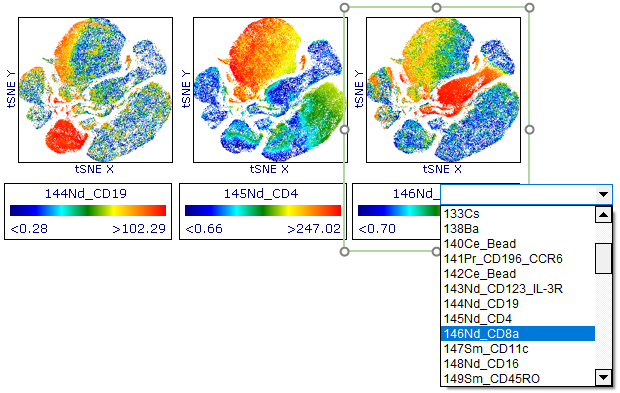
Color Based on parameter indicated in the Legend text of each plot. Example above shows Density plots with the Flame Color Level.
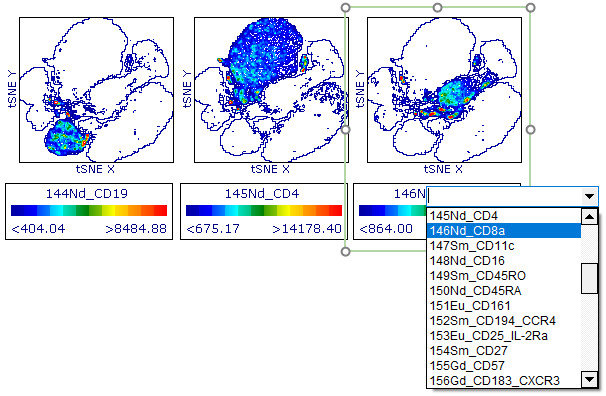
Color Based on parameter indicated in the Legend text of each plot. Example above shows Contour plots with outliers enabled.
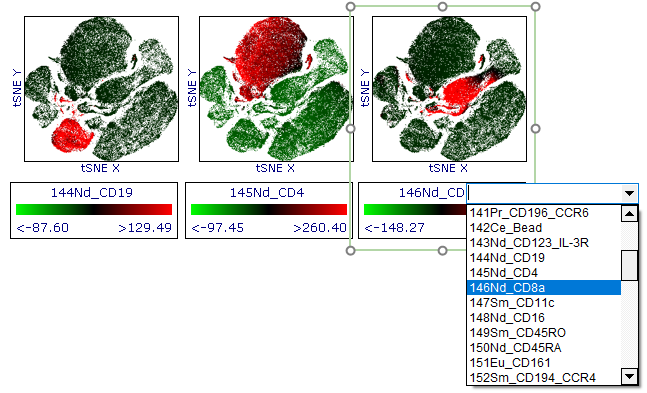
Color Based on parameter indicated inLegend text of each plot. Example above shows Density plots with Green-Black-Red Color Level with a Style of Mean +/- SD and Standard Deviations set to 2.00.
Gates may be created on any combination of standard or tSNE parameters on any plot type to specifically select the events within one or more tSNE islands/continents. Gated populations may also be used to gate or backgate events on any tSNE transformed plot. Once gated, histograms can be used for the quick visualization of multiple parameters within a gated tSNE cluster using the Parameter Overlays feature.
An example of "tSNE island..." gates drawn on a tSNE X vs Y plot, and subsequently backgated or applied to other plots, is shown below (Figure 9.150).
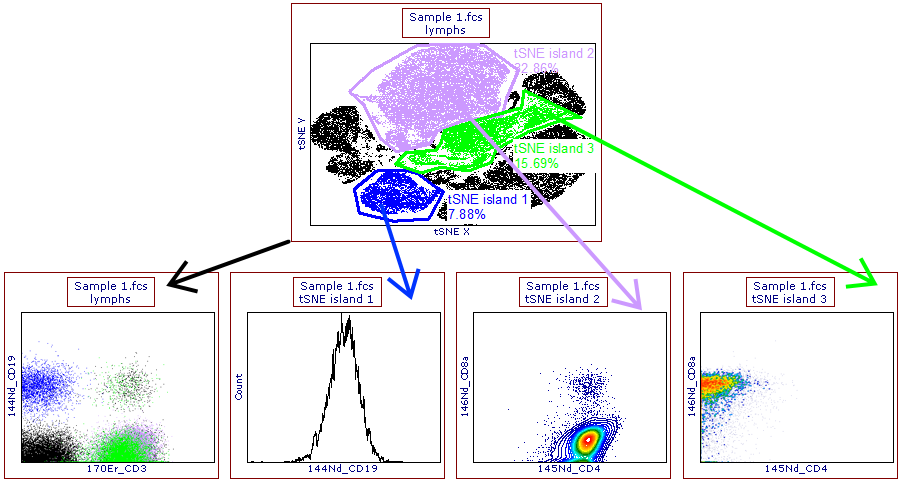
Figure 9.149 Gates have been drawn on tSNE parameters (upper panel) and have been displayed (lower left plot) or applied (lower central, right, and far-right plots) to other plots.
An example of multiple parameters within the "tSNE island of unknown phenotype" gate, visualized on a histogram using the Parameter Overlays feature, can be seen below (Figure 9.151).
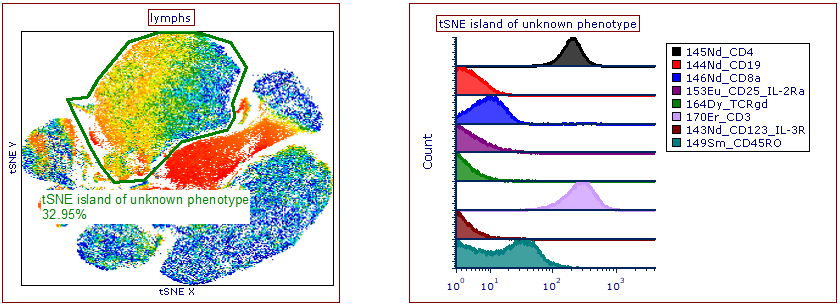
Figure 9.150 Parameter Overlays have been added to the histogram (right plot) to visualize multiple parameters across the Unknown gated tSNE island (left plot).
