Analyzing and Exporting Multi Channel Image Results with an .ijx file
In this section, you will learn how to analyze and export a group of multi channel image results from ImageJ using the DNSMacroExample and an .ijx analysis configuration file, which was created in the previous section with the macro-enabled Excel worksheet* or manually edited in ImageJ or Excel.
We will be using the macros and images from the tutorial sample data set→ImageJ Tutorial folder. The DNSMacroExample.ijm macro will be used along with the images found in the Multi Channel Analysis folder (Images 1 and 2 for the DAPI and FITC channels).
1. Open ImageJ.
2. Install the DNSMacroExample in ImageJ (Note: if the DNSMacroExample has already been installed, you may skip step 2).
When this macro file is installed in ImageJ (Plugins→Macros→Install), a red rectangle with three color blobs button with the hint "De Novo Software Exporter" will be shown in the toolbar (Figure T27.19).

Figure T27.19 ImageJ Toolbar with the DNSMacroExample.ijm Macro Installed
3. Click on the De Novo Software Exporter button (Figure T27.19, indicated by cursor).
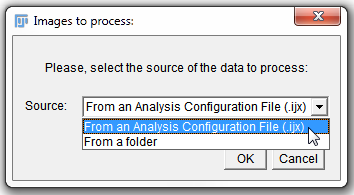
4. In Images to process: window, choose From an Analysis Configuration File (.ijx) (Figure T27.20).

Figure T27.20 Choosing an .ijx to Process Images
5. Click OK.
6. Choose either DeNovo.ijx (if your .ijx file was created with the macro-enabled Excel worksheet) or FileListForDnsExporter.ijx (if your .ijx file was manually edited in ImageJ or Excel) from the Multi Channel Image Experiment folder within ImageJ Tutorial subfolder of the Tutorial Sample Data archive.
7. Click Open.
8. Choose dapi as the Channel.
Choosing the channel in step 8 will define which channel should be used for image segmentation. In this case we are using the dapi stain which is defining the nuclear area of the cells for segmentation.
9. Click OK.
ImageJ will process all of the files listed in the .ijx Analysis Configuration file and create a .ijout file for each set of two channel images and a folder for each of the matching .results.txt and .mask.tif files.
We now will open the exported data with FCS Express.
10. Open FCS Express.
11. Click the Insert tab→2D Plots group→Dot command.
12. Click anywhere on the layout to insert the dot plot.
13. Choose ImageJ Files (*ijout) from the Files of type drop-down list in the Select data file dialog.
14. Navigate to the Multi Channel Image Experiment folder in the ImageJ Tutorial subfolder of the Tutorial Sample Data archive.
15. Choose Image1DAPI1.ijout.
16. Click Open.
17. Click on the Insert tab→Other Plots group→Picture Plot command.
18. Click anywhere on the layout to insert the picture plot.
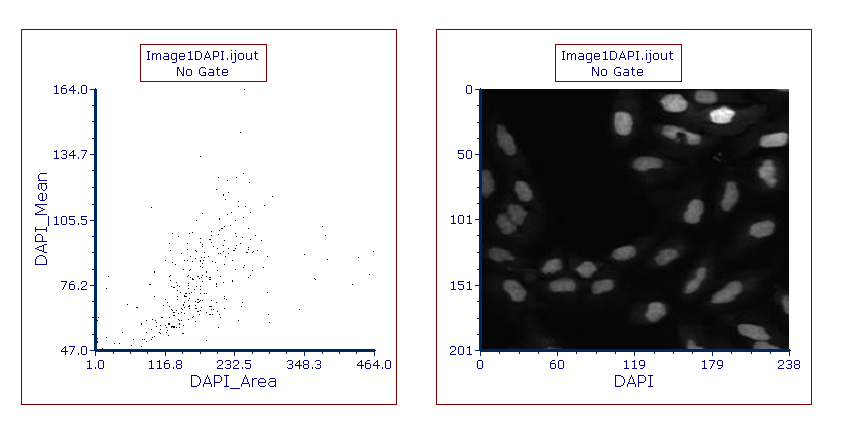
The layout should contain both a dot plot and a picture plot displaying the data exported from ImageJ (Figure T27.21). Using the Next and Previous buttons from the Data tab→Change Data on All Objects group will change the data displayed from the first and second images. By clicking Dapi on the x-axis of the picture plot, you will be able to choose between the DAPI and FITC channels (Figure T27.21, right). Please see additional resources listed below for more information about working with plots and imaging data in FCS Express.

Figure T27.21 Dot and Picture Plots Display Data from .ijout File
Note about panning and zooming (please refer the working with picture plots chapter for more details)
By default, Picture plots display images at their original zoom starting from their top-right corner. When the original size of the picture exceeds the size of the plot, to see a larger part of the picture the user can:
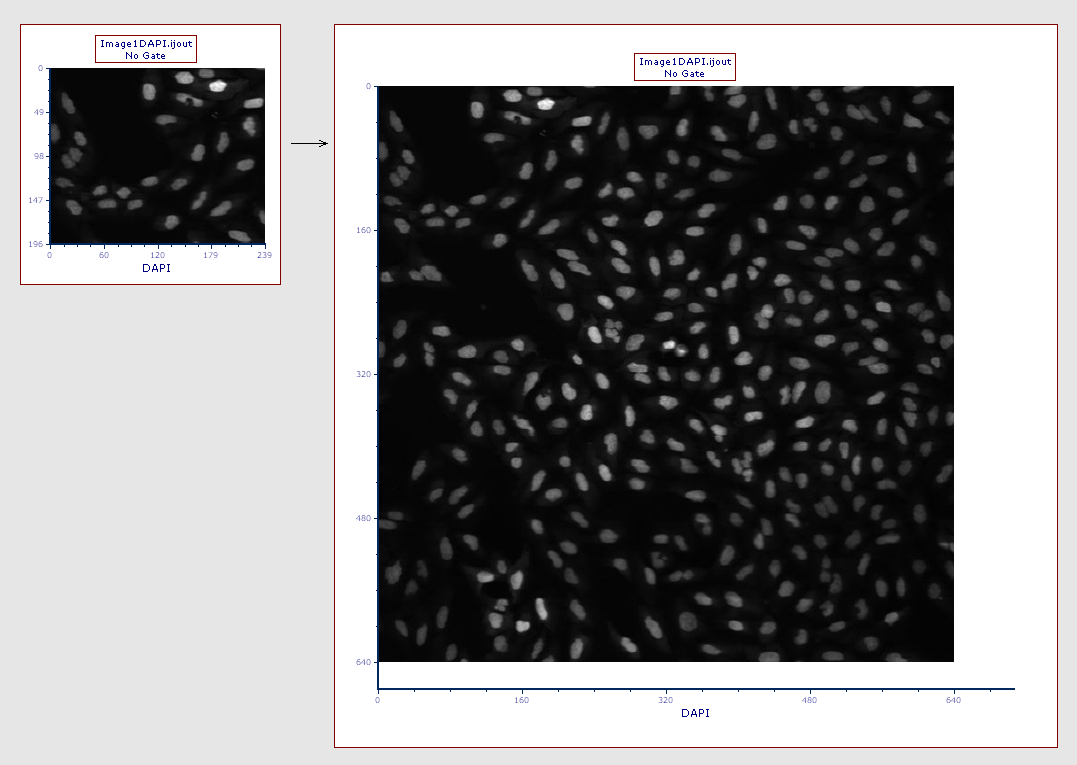
•enlarge the plot itself and/or (Figure T27.21a below)
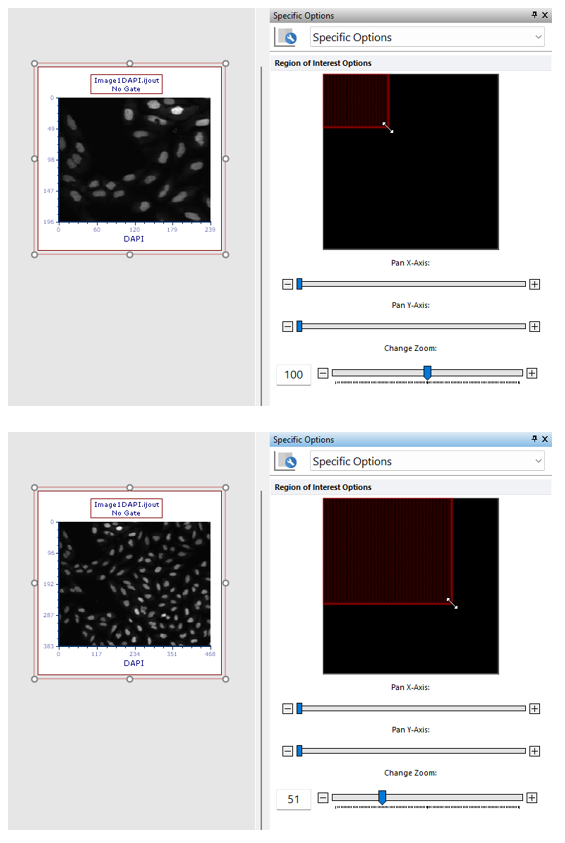
•change the zoom of the Picture plot by selecting Specific Options from the Format tab of the ribbon bar (Figure T27.21b below). Should the zooming not being enough, the plot can be resized in addition.
If a different region of the image should be displayed within the picture plot, please change the panning (please refer the working with picture plots chapter for more details).

Figure T27.21a
The picture plot (left) has been resized in order to display teh full picture (right)

Figure T27.21b
The picture plot (top) has been zoomed through the Specific Options dialog in order to display a larger part of the picture (bottom).
Further Resources:
•Introduction to FCS Express Image Cytometry Tutorial
•ImageJ for FCS Express Knowledge Base
*macro written by Peter Haub
