1D Plot Options
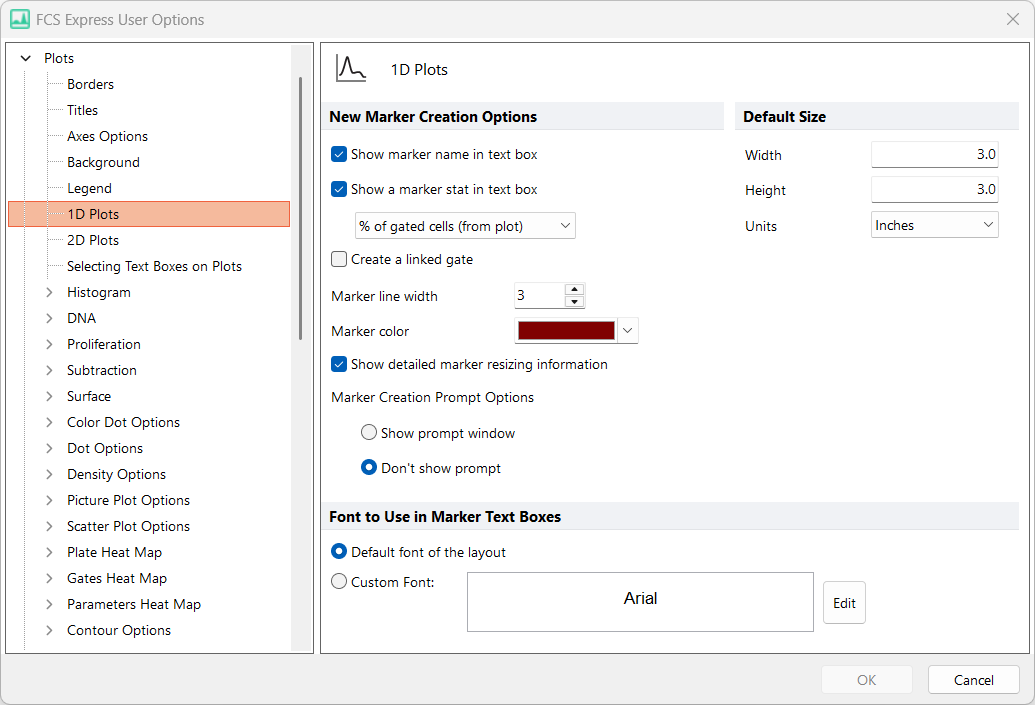
The 1D Plot options are shown in Figure 20.11.

Figure 20.11 1D Plot Options
The options that are specific for 1D plots are described in the table below.
Option |
Explanation |
|
|---|---|---|
New Marker Creation Options |
Show marker name in text box |
When a marker is created, you can choose whether or not to show the marker name.
|
Show marker stats in text box |
When a marker is created, you can choose whether or not to show the marker stat in a text box. If marker stat is enabled, you can choose which statistic to display from the drop-down list. |
|
Create a linked gate |
If this check-box is checked, when a new marker is created on the histogram, a gate linked to the marker will automatically be created. Markers existing prior to activating this setting will still need to be manually linked to a gate, if desired. |
|
Marker line width |
This option allows the user to set the default marker line width. |
|
Marker color |
This option allows the user to set the default marker line color. |
|
Show detailed marker resizing information |
If this check-box is checked, the marker boundaries will appear above the marker and lines will drop to the axes to show where the marker boundaries will be during resizing. |
|
Marker Creation Prompt Window |
If Show prompt window is selected, a dialog window will appear upon marker creation that allows the user to name the marker, define the label in the marker text box, create a linked gate, and define the marker line width and color, if desired. If the default of Don't show prompt window is selected, defaults for these marker properties will apply, and can be changed later on demand via the Marker Formatting dialog. |
|
Font to Use in Marker Text Boxes
|
The default font to use in marker text boxes. |
|
Default Size
|
Width, Height and Units |
The default size of 1D Plots. |
