Plot Tokens
Plot Tokens allow you to insert information pertaining to a plot selected as Data Source .
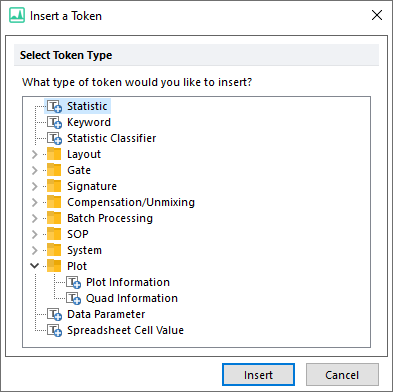
There are two types of Plot Tokens (Figure 12.41):
•Plot Information
•Quad Information
Please see below for more details on them.

Figure 12.41 - Selecting Plot Token from the Select Token Type dialog
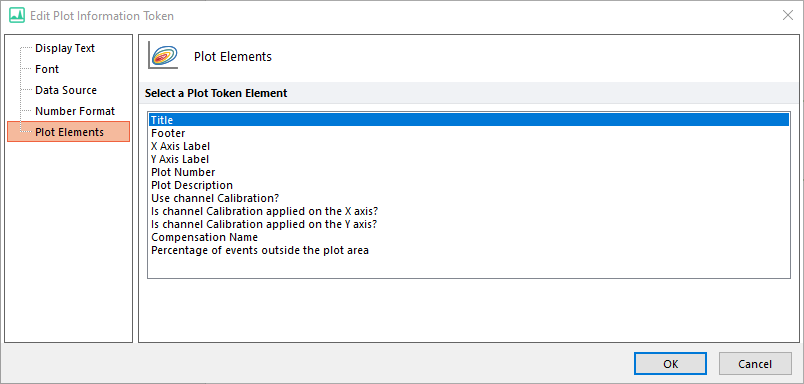
Once a Plot Information token is created the Edit Plot Information Token dialogue box will open and allow you to define and edit the token as appropriate. It is also possible access this dialogue box at a later point, by right-clicking on the token (Figure 12.42). The following properties of the token are available to edit:
•Display Text - defines if the token should display the Token Value (default), Token Description, or a user-defined Text.
•Font - changes the font depending on the value of the token based on a list of classifications.
•Plot Element - defines which information the token should display (see the table below for more details).

Figure 12.42 - Plot Elements
Plot Element |
Definition |
Title |
The text within the plot title. |
Footer |
The text contained with the plot footer. |
X Axis Label |
The label used for the X axis within the plot. |
Y Axis Label |
The label used for the Y axis within the plot. |
Plot Number |
The number given to the plot by FCS Express as it is created. |
Plot Description |
An overall description of the plot, showing the Plot Number, Plot Type, the data file name being displayed within the plot, and the X and Y axis parameters for the selected plot. |
Use Channel Calibration? |
Has the Use Channel Calibration on Axes option been selected for that plot? The output is Off or On. |
Is Channel Calibration Applied on X axis? |
A description of whether or not channel calibration has been applied to the X axis. |
Is Channel Calibration Applied on Y axis? |
A description of whether or not channel calibration has been applied to the Y axis. |
Percentage of events outside the plot area |
A statistic describing the percentage of events which are on or beyond the currently displayed plot edges |
This token will display a given coordinate or pair of coordinates (X- and Y-) for a selected vertex of a Quadrant.
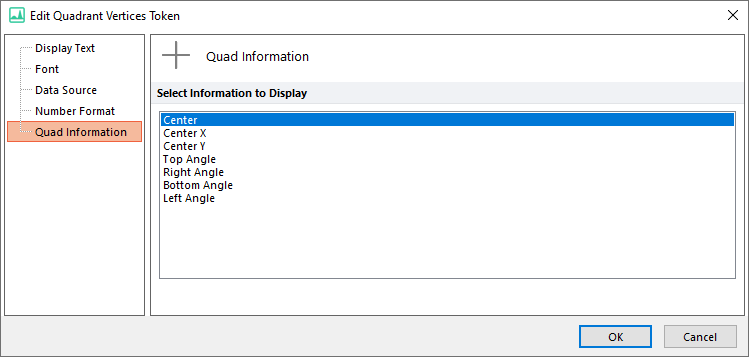
The following properties can be edited for Quad Information tokens, by right-clicking on the token:
•Display Text - defines if the token should display the Token Value (default), Token Description, or a user-defined Text.
•Font - changes the font depending on the value of the token based on a list of classifications
•Data Source - identifies the plot that determines Token Value
•Number Format - assigns the number of decimals and number display options
•Quad Information - The options are Center (both X and Y coordinates), Center X, Center Y, Top Angle, Right Angle, Bottom Angle, Left Angle. See Figure 12.43.
•

Figure 12.43 - Quad Information
