The Format Tab
The Format Tab (Figure 3.32) allows you to change the properties of one or more selected objects. To access this tab, one or multiple plots must first be selected.

Figure 3.30 Format Tab
•Object Options: Each command brings up a dialog box to set object properties.
oThe General command is for assigning or changing the object name and the object visibility.
oWith the Size command, you can change or scale the height and width of objects. An option exists to lock the aspect ratio so that the ratio of the height to width are kept constant.
oThe Fill command is used for setting the objects background characteristics (color, image), changing the margins of the object, and adjusting the frame.
oThe Border/Lines command is used to set the style, color, and width of lines surrounding the border of the selected object(s).
oThe Authorizations command is used to define what select and edit actions are accessible for the object(s).
oThe Gate View Options command allows to view plot information for plots gated on a gate within the Gate View and/or view Data Specific Gates within the Gate View.
oThe Selected Gate or Quads command is used to format the properties of a gate or quadrant that is currently selected.
oThe Text Box Contents command allows editing of marker, gate and quadrant text boxes.
•Data Options
oThe Gates to Display command is used for choosing which gates to display in a plot or Data Grid.
oThe Parameters to Display command allows you to choose which parameters are shown in a data grid.
oThe Data Image Options command controls image placement in the cells of a Data Grid.
•Plot Options
oThe Overlays command is used to choose the characteristics of an overlay including, x- and y-parameters, gates, compensation, color, and dot size, among other things.
oThe Axes, Title, and Legend commands allow you to format and position the text used in these areas of the object.
oIf you are working with a histogram or surface plot, the 3D command is used to format the properties of the display, such as zoom, rotation, elevation, offsets, and perspective.
oThe Specific Options command allows you to change specific options that are related to the particular plot that is selected, e.g., the resolution of a plot, and to indicate how many cells to plot.
oThe Text Boxes Selection command allows you to allow or disallow selection of text boxes from markers, gates, and quadrants when shown on plots.
•1D Options
oIf marker(s) have been created, the Markers command is used for formatting the properties of the markers on single-parameter histograms.
oIf a Proliferation Plot has been created, the Proliferation Fit command allows you to access Proliferation Fit options.
oIf a Proliferation Plot has been created, the Position Markers command allows you to access Position Marker options.
•2D Options
oIf you are working with a 2D color plot (e.g., color dot plot, density plot, contour plot) the Color Levels command is used to format the properties of the colors displayed.
oIf you are working with a Scatter with Regression plot the Regression Fit command always you to quickly access regression model options.
oIf statistics are displayed in a default statistics window, the Statistics command allows you to format the properties of the statistics window. Available commands are:
•Statistics - controls general statistic formatting
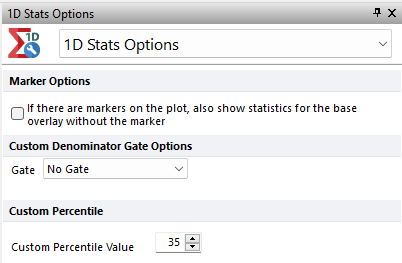
•1D Stats Options - controls options for statistics from 1D plots.
This dialog can also be opened by right-clicking on a Statistics table, selecting Format in the right-click menu and then selecting the 1D Stats Options category from the drop-down menu of the Formatting dialog.
•The If there are markers on plot, also show statistics for the base overlay without the marker check box allows you to display statistics for the entire overlay with no marker applied.
•The Custom Denominator Gate Options drop-down menu allows you to select the Gate to use as denominator for the % of custom denominator gate statistics (see the Histogram Statistics chapter).
•Custom Percentile, allows you to define a Custom Percentile Value for the N%-ile (N - custom value) Histogram Statistic. Values allowed goes from 1 to 99.

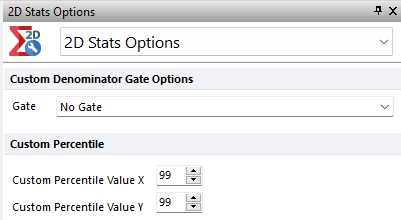
•2D Stats Options - controls options for 2D plots gate statistics.
This dialog can also be opened by right-clicking on a Statistics table, selecting Format in the right-click menu and then selecting the 2D Stats Options category from the drop-down menu of the Formatting dialog.
•The Custom Denominator Gate Options drop-down menu available in the 2D Stats Options panel allows you to select the Gate to use as denominator for the % of custom denominator gate statistics (see the 2D Plot Statistics chapter).
•Custom Percentile, allows you to define a Custom Percentile Value for the X and Y N%-ile (N - custom value) statistics (see the 2D Plot Statistics chapter). Values allowed goes from 1 to 99.

•Change
The Change Plot Type command allows you to change the type of a selected plot. By clicking on the down arrow associated with the Change Plot Type command, you expand the item to reveal all of the possible plot types.
