分析和输出.ijx文件格式的多通道图像结果
本章节中,我们将学习如何从ImageJ中分析和输出一组多通道图像结果。方法是使用DNSMacroExample和一.ijx分析配置文件,该配置文件是在之前章节创建的,带有macro-enabled Excel worksheet(宏-激活的Excel工作表)*或者manually edited in ImageJ(在ImageJ中手动编辑)或者Excel。
我们将使用来自教程样本数据集→ImageJ教程文件夹中宏和图片。DNSMacroExample.ijm宏将和多通道分析文件夹中的图片(针对DAPI和FITC通道的图片1和图片2)一起使用。
| 1. | 打开ImageJ。 |
| 2. | 在ImageJ中安装DNSMacroExample(注意:如果已经安装了DNSMacroExample,请跳过第2步)。 |
当这个宏文件被安装到ImageJ中(Plugins(插件)→Macros(宏)→Install(安装)),一个带有三色斑点按钮的红色矩形、带有"De Novo Software Exporter"提示的将显示在工具栏中(图T28.113)。

Figure T28.113. The ImageJ tool bar with the DNSMacroExample.ijm macro installed. Notice the red rectangle with three color blobs button that indicates the De Novo Software Exporter.
| 3. | 在Image J工具条中点击De Novo Software Exporter(De Novo Software出口商)按钮(带有三色斑点的红色矩形)(图T28.113)。 |
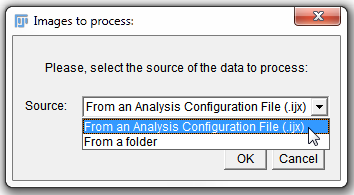
| 4. | 选择From an Analysis Configuration File(来自一分析配置文件) (.ijx)(图T28.114)。 |

Figure T28.114 Choosing an .ijx file to process images.
| 5. | 点击OK。 |
| 6. | 选择DeNovo.ijx(如果您创建的.ijx文件带有macro-enabled Excel worksheet(宏-激活的Excel工作表))或者FileListforDnsExporter.ijx(如果您的.ijx文件带有manually edited in ImageJ(在ImageJ中手动编辑)或者Excel),来自教程样本数据文件夹中的Multi Channel Image Experiment(多通道图片实验)文件夹→ImageJ 教程 目录文件夹。 |
| 7. | 点击Open(打开)。 |
| 8. | 选择dapi作为通道。 |
在第8步选择的通道将定义哪个通道将用于图片分隔。在本例中,我们将把用来定义细胞核区域的dapi染色作为进行分割。
| 9. | 点击OK。 |
ImageJ现在将处理列于.ijx分析配置文件中的所有文件,及为每两个通道图片集合创建一个.ijout文件、为每个相匹配的 .results.txt和.mask.tif文件创建一个文件夹。
我们现在将用FCS Express打开导出的数据。
| 10. | 打开FCS Express 5 图片分析软件。 |
| 11. | 点击Insert Tab(插入标签)→2D Plots(二维绘图)→Dot(点状图)。 |
| 12. | 在版面上的任何位置点击,来插入点状图。 |
| 13. | 从Files of type(文件类型)下拉菜单中选择ImageJ Files (*ijout)。 |
| 14. | 导航到Tutorial Sample Data folder(教程样本数据文件夹)→ImageJ Tutorial(ImageJ教程)→Multi Channel Image Experiment(多通道图片实验)→Multi Channel Analysis(多通道分析)文件夹。 |
| 15. | 选择Image1DAPI1.ijout。 |
| 16. | 点击Open(打开)。 |
| 17. | 点击Insert Tab(插入标签)→2D Plots(二维绘图)→Picture Plot(图片绘图)。 |
| 18. | 在版面上的任何位置点击,来插入图片绘图。 |
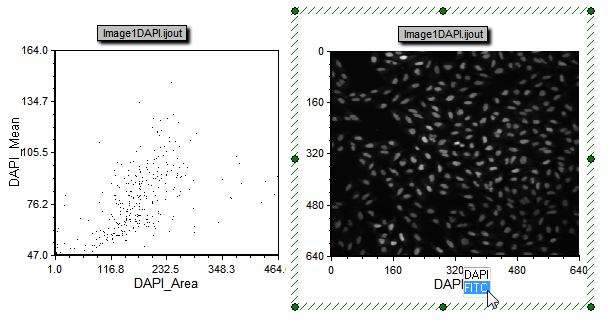
现在版面应该包含来自ImageJ数据的点状图和图片绘图(图T28.115)。使用Data Tab(数据标签)→Change Data on All Objects(更改所以对象上的数据)部分的Next(下一项)和Previous(前一项)将更改处理过的来自第一和第二个图片见的数据。通过点击图片绘图(DAPI)上的通道标签,您将能够在DAPI和FITC通道间进行选择(右图T28.115)。要详细了解FCS Express中一起使用绘图和图片数据,请参见下面列出的更多资源教程。

Figure T28.115 A dot plot and picture plot created from the .ijout files that were exported using the .ijx analysis configuration file. Since there are multiple channels you can change the axis of the picture plot to choose which channel to view.
更多资源:
Peter Haub写的*macro
