在这一章节,我们将:
注意:这一教程的该章节由三个Save Points(保存点),因此在以下保存点后,您可以保存您的进程,然后返回到这些保存点:
版面已被保存为与任何.fcs文件不关联,因此出现的是空的绘图(图T29.1)。不关联.fey文件(版面),在将来遇到相似实验时,能更方便的作为一个模板运用。学习更过关于版面保存的三个选项的知识。
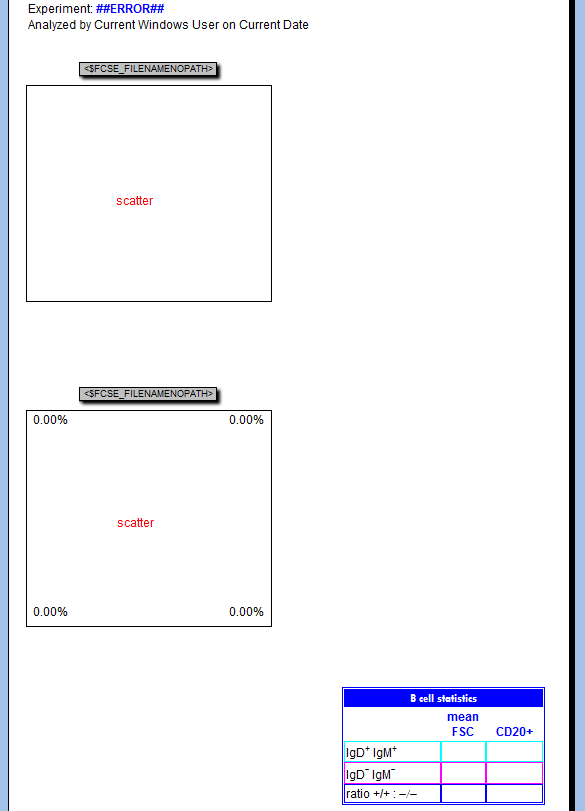
Figure T29.1 Immunophenotyping Tutorial.fey. Note that plots appear empty because the layout is saved as "unlinked".
首先,我们将更改Default Options(默认选项),这样我们的.fcs文件将衍生出Stain and Name keywords(染色和名称关键字),出现在我们的绘图坐标轴上。
我们现在将加载一个.fcs文件到绘图中。
| 4. | 从Ribbon版面中选择Data(数据)标签→Change Data on All Objects(修改所有对象上的数据)→Select(选择) (图T29.2 )。 )。 |
| 5. | 在出现的选择一个数据文件对话框中,导航到教程样本数据库中的 "Immunophenotyping Tutorial"文件夹 (图T29.2 )。 )。 |
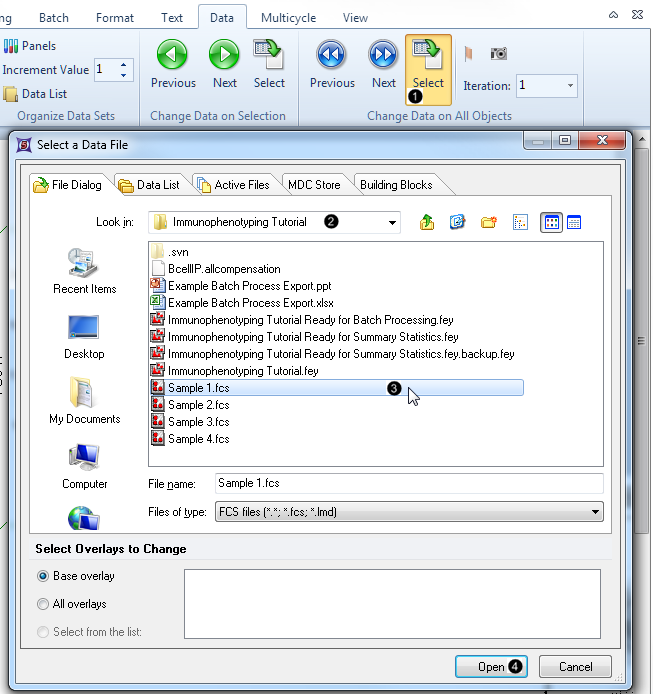
Figure T29.2 Loading .fcs files into the plots
| 6. | 在 选择一个数据文件对话框中 选择"Sample 1.fcs"(图T29.2 )。 )。 |
| 7. | 点击Open(打开)(图T29.2 )。 )。 |
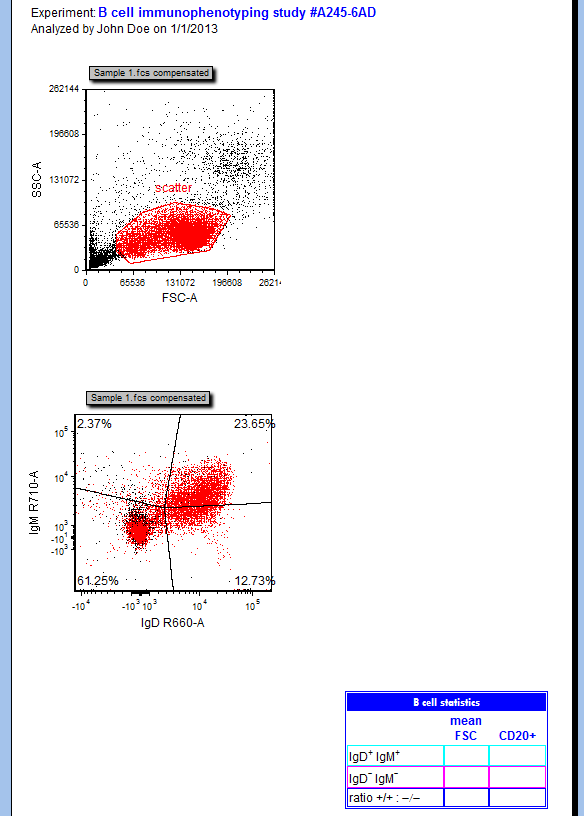
Figure T29.3 2D plots after changing file
| 8. | 在 "scatter"红色门边框内点击,并按住鼠标左键不放(图T 29.4)。 |
| 9. | 将"scatter"门从绘图中拖拽到其右边的空白版面处(图T29.4 ),拖拽过程中持续按住鼠标不放。 ),拖拽过程中持续按住鼠标不放。 |
| 拖拽时,在原图上你可以看到,门轮廓的影子将沿着虚线箭头移动。 |
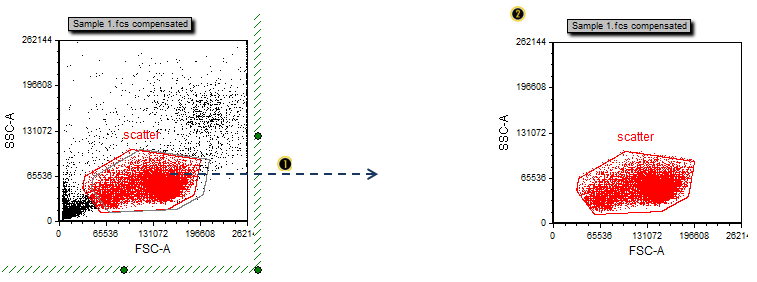
Figure T29.4 Dragging and dropping the "scatter" gate out of a plot to make a new plot gated on "scatter"
| 10. | 当光标处于版面原始绘图右边空白处时,松开鼠标。 |
| 拖拽结束时,圈中该"scatter"门的新的绘图将出现(图T29.4 )。 )。 |
| 12. | 选择 "CD45 V800-A" 作为参数,通过鼠标指针将其高亮显示(图T29.5)。 |
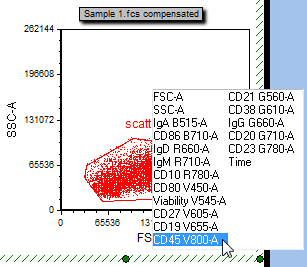
Figure T29.5 Changing the X-parameter of a plot
| 14. | 在新绘图的Y-坐标轴上 重复 第11-13步,选择“CD19 V655-A”作为新的参数。 |
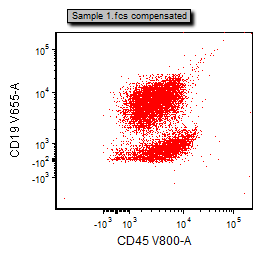
Figure T29.6 Plot with X- and Y-parameters changed to CD45 V800-A vs CD19 V655-A
| 15. | 从Ribbon界面选择Gating(门操作)标签→Create Gates(创建门)→Polygon(多边形门)(图T29.7)。 |
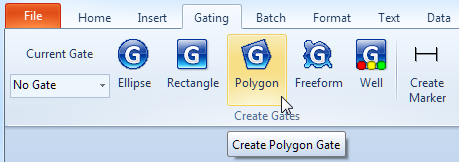
Figure T29.7 Selecting a gate shape from the Gating tab of the ribbon
| 16. | 在右边绘图的CD45+CD19+群外围(如下图所示)每个顶点处点击一下,用以创建门(图T29.8). |
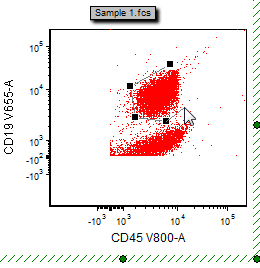
Figure T29.8 Drawing a polygon gate
| 17. | 通过点击您定义的第一个顶点,将门封闭完成(图T29.9 )。 )。 |
| 此时,一个对话框将出现,可在此对话框中对门名称、颜色和包含/排除属性进行定义。 |
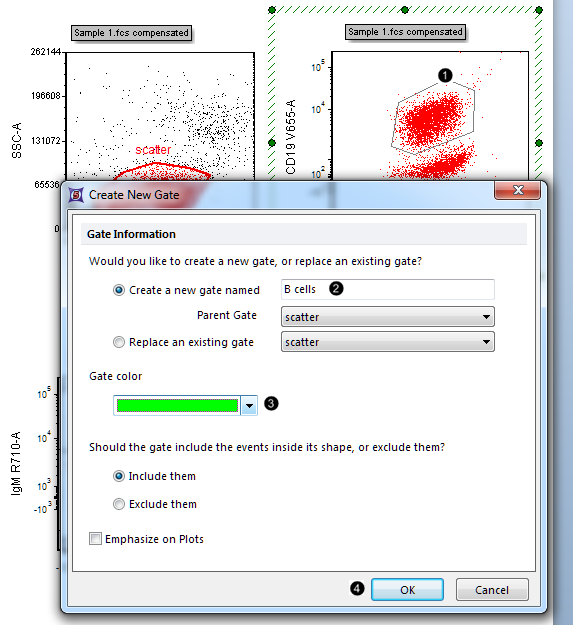
Figure T29.9 Closing and naming a polygonal gate
| 18. | 请在Create a new gate name(创建一个新门的名称)处输入"B cells"(图T29.9 )。 )。 |
| 19. | 从Gate color(门颜色)下拉选择中选择bright green(鲜绿色) (图T29.9  )。 )。 |
| 20. | 点击OK(图T29.9  )。 )。 |
| 21. | 选择File(文件)标签→Save As(保存为),将该版面保存为linked(相关联的) (第二个单选按钮,展示于图4.2)。在该章节之后的时间,您可以点击该页面顶端的Save Point #1来回到这一步骤。 |

Save Point #1 (Step 21)
我们现在将通过对左下角的"B cells"门进行gating the plot(圈中绘图)方式,来对B细胞群体的表型进行详细了解。
| 22. | 在绿色"B cells"门边框内任意地方点击鼠标左键,并按住不放(图T29.10)。 |
| 23. | 将该门拖拽到左下角的绘图中。拖拽时,门轮廓的影子将沿着虚线箭头移动(图T29.10 )。 )。 |
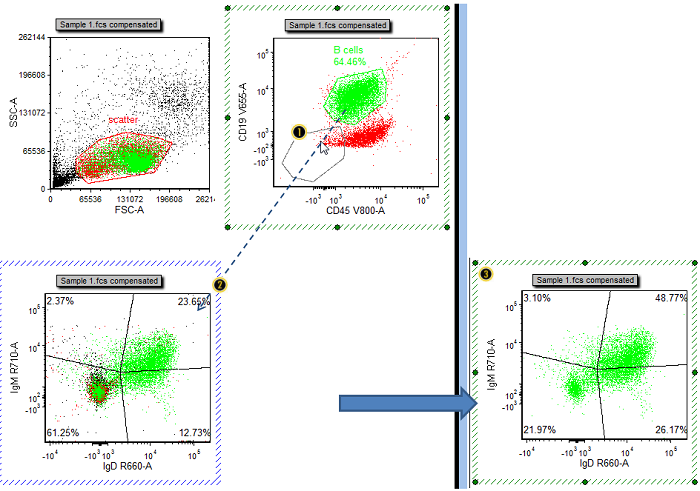
Figure T29.10 Gating a plot by dragging and dropping a gate from another plot
| 24. | 当左下角绘图的轮廓变为蓝色,松开鼠标左键(图T29.10 )。 )。 |
| 此时,左下角的绘图圈中了"B cells",看上去如图T29.10所示 。 。 |
| 25. | 在选中左下角绘图的情况下,从Ribbon界面选择Format(格式)标签→Change(更改)→Change Plot Type (更改绘图类型) (图T29.11所示)。 |
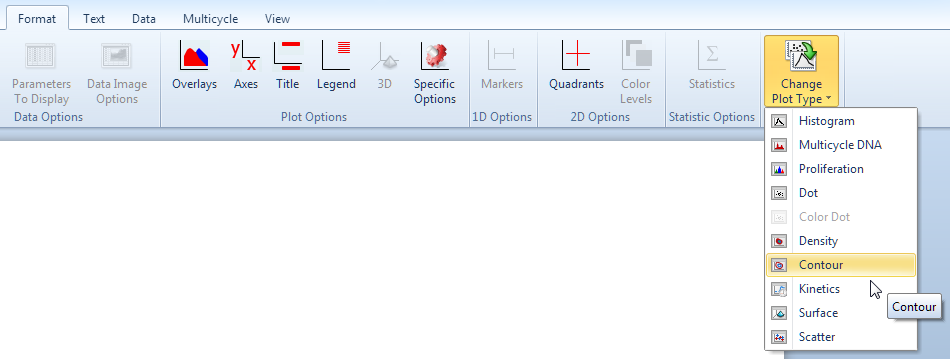
Fig. T29.16 Changing plot type
| 26. | 点击Contour(等高线)(图T29.11)。 |
| 此时,绘图看上去与图T29.12中高亮的绘图类似。 |
可选操作:添加outlier dots(离群点)到Contour Plot(等高线图)中,具体操作见步骤27-32步。如不进行可选操作,直接进入第33步。
| 27. | 右键点击Contour Plots(等高线图)。 |
| 28. | 从关联的弹出菜单中选择Format(格式)(图T29.12,鼠标光标处)。 |
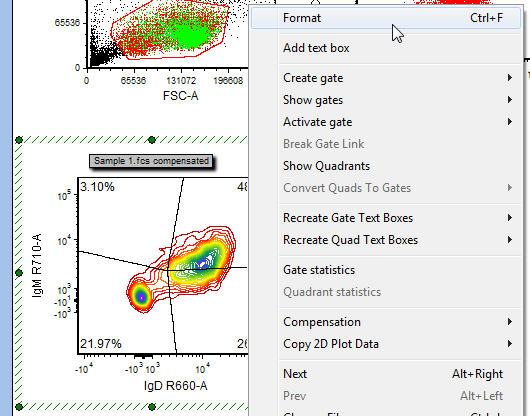
Figure T29.17 Right-clicking on a plot to reformat its appearance
| 29. | 点击左边的Overlays(数据层)项目类别((图T29.13 )。 )。 |
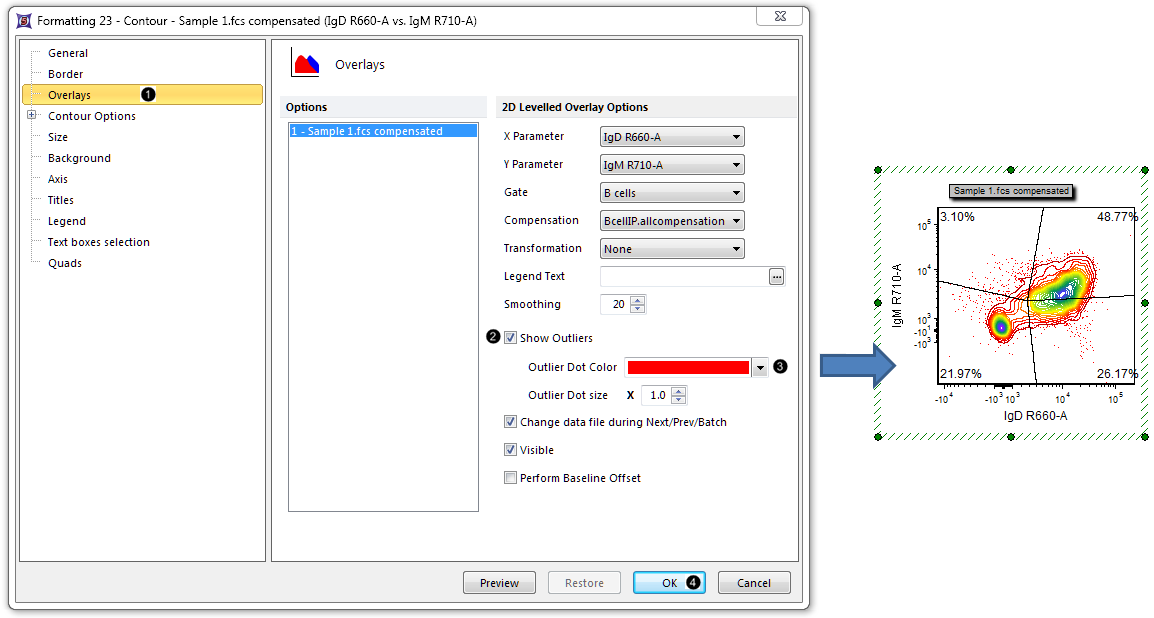
Figure T29.18 Adding outlier dots to a contour plot
| 30. | 选中Show Outliers(显示离群值)复选框(图T29.13 )。 )。 |
| 31. | 变更Outlier Dot Color(离群点颜色)为红色(图T29.13 )。 )。 |
| 32. | 点击OK(图T29.13 )。此时,绘图看上去和图T29.13相似,右边。 )。此时,绘图看上去和图T29.13相似,右边。 |
我们现在将详细检测B-cells中IgD/IgM双阴性和IgD/IgM双阳性的表型。
| 33. | 按住象限的十字交叉点(如图T29.14所示),将十字象限拖拽到一个合适的位置,让双阴性和双阳性群体更好的划分。 |
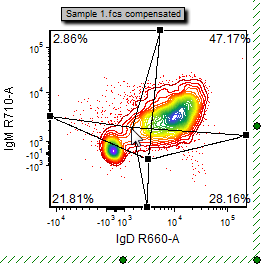 Figure T29.14 Adjusting the central quadrant vertex |
| 35. | 选择Convert Quads to Gates(把象限转化为门)→Upper Right(右上象限)→Convert and Link(转化并链接)(图T29.15,鼠标光标处)。 |
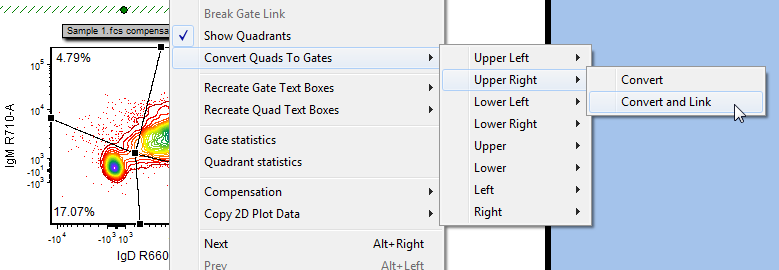
Fig. T29.15 Converting and linking the upper right quadrant to a gate
| 36. | 重复第18-20步,但是将门的名字命名为"double positive",颜色选为turquoise(蓝绿色) ,用以匹配右下角的预格式化的文本表格。 |
| 37. | 重复第34-36步,用以Convert and Link(转化并链接)左下象限 到一个门上。 |
| 38. | 重复第18-20步骤,但是将门的名字命名为"double negative",颜色选为pink(粉色) ,用以匹配右下角的预格式化的文本表格。 |
| 39. | 选择File(文件)标签→Save As(保存为),将该版面保存为linked(相链接)类型 (第二个单选按钮,展示于图4.2),或者简单的按下Ctrl + S键, 在您已经将该版面保存为linked(相链接)Save Point #1的情况下。在该章节之后的时间,您可以点击该页面顶端的Save Point #2来回到这一步骤。 |

Save Point #2 (Step 39)
| 40. | 在Ribbon界面选择Insert(插入)标签→1D Plots(一维绘图)→Histogram(柱状图) 图T29.16,红色轮廓)。 |

Figure T29.22 Selecting histogram from the Insert tab of the Ribbon
| 41. | 在预格式化表格上方的空白处点击鼠标左键,按住不放(图T29.17)。 |
| 42. | 按住光标,将柱状图拖放到合适的大小(图T29.17 )。 )。 |
| 注意:您版面中的任何绘图、文本框或其他对象,均可在任意时间重新设置大小。 |
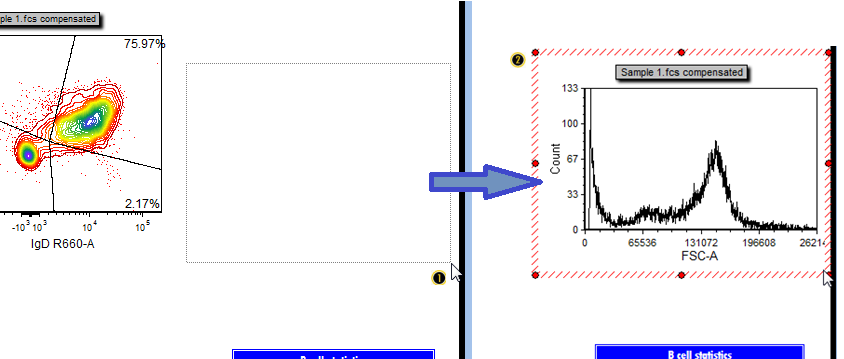
Fig. T29.17 Inserting a histogram onto the layout
| 43. | 然后,请松开鼠标。此时,一个新的柱状图将出现,与图T29.17相似 。 。 |
我们现在将在柱状图上,把"double-positive" 和"double-negative" 群体叠加在一起,用以比较他们CD20的表达。
| 45. | 在相关联的弹出窗口中选择Add Overlay(添加叠加图层)(图T29.18)。 |
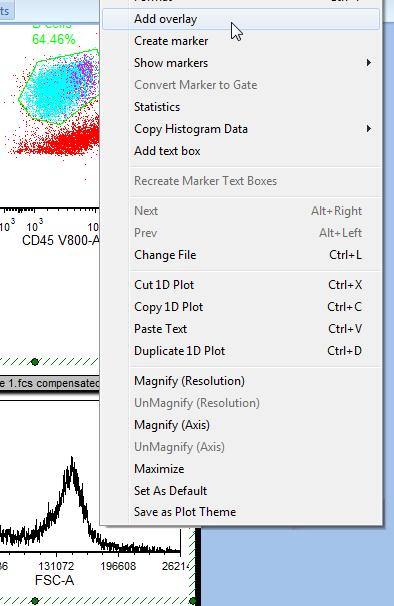
Figure T29.18 Adding an overlay to the histogram by right clicking on the plot and choosing "Add Overlay"
| 47. | 在出现的附加的对话框中点击OK(图T29.19)。 |
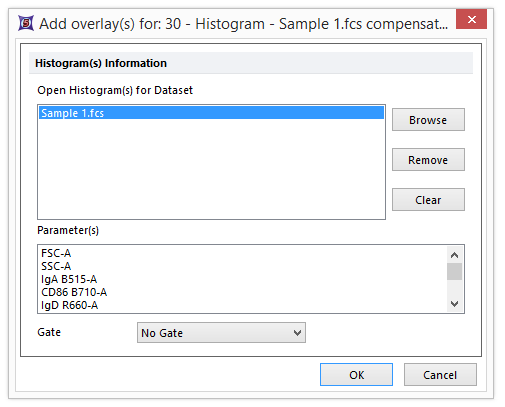
Fig. T29.19 Additional dialog box for adding overlays
| 49. | 在相关联的弹出窗口中选择Format(格式)(图T29.26)。 |
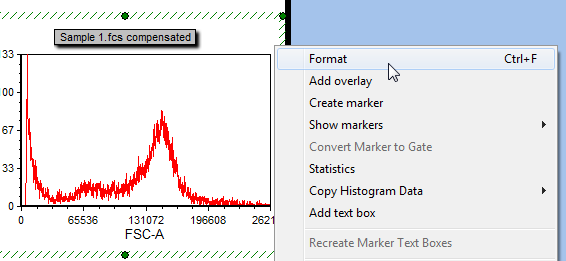
Figure T29.20 Right-clicking on the 1D-plot to access Format options
| 50. | 选择位于左边的Overlays(数据层)选项(图29.27 )。 )。 |
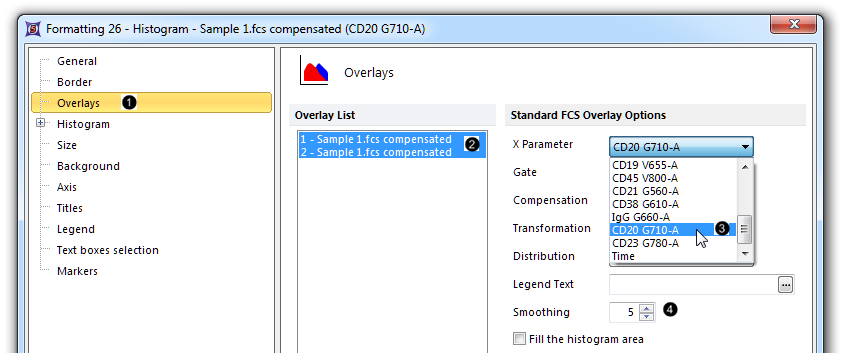
Figure T29.21 Formatting histogram overlays
| 51. | 在键盘上按住Ctrl(Control)键,通过点击选中两个数据层(图29.21 )。 )。 |
| 52. | 从X Parameter(X 参数)下拉列表中选择“CD20 G710-A”(图29.21 )。 )。 |
| 54. | 点击第一个数据层(“1-Sample 1.fcs compensate...”),其单独被选中(图29.22 )。 )。 |
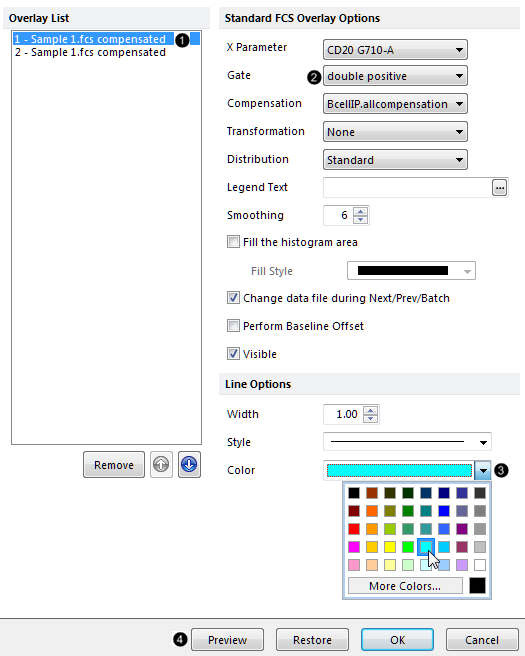
Figure T29.22 Formatting histogram overlays, continued
| 55. | 从Gate(门)下拉列表中选择“double positive”(图29.22 )。 )。 |
| 56. | 在Line Options(线型选项) 下,为它选择turquoise(蓝绿色)(图29.22 )。 )。 |
| 57. | 重复第54-56步,但这次是点击第二个数据层 ("2-Sample 1.fcs compensate...”),然后选择"double negative"作为门,选择pink(粉色) 作为该门的颜色。 |
| 58. | 点击Preview(预览)(图29.22 )。(注意:移动格式化窗口到一边,来更好的预览绘图中格式的改变) )。(注意:移动格式化窗口到一边,来更好的预览绘图中格式的改变) |
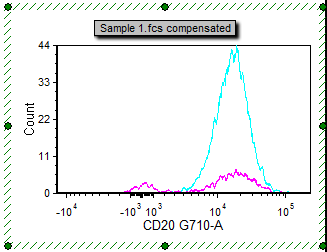
Figure T29.23 Preview of gates, colors, and smoothing applied to both histogram overlays
可选操作:标准化该柱状图,第59-62步。如不进行可选操作,直接进入第63步。
| 59. | 扩张该柱状图, 在左边的项目类别(图T29.24 )。 )。 |

Figure T29.24 Normalizing a histogram
| 60. | 点击Histogram Specific Options(柱状图特定选项)(图T29.24 )。 )。 |
| 61. | 从Normalize to(标准化于)下拉列表中选择Peak Value(峰值)(图T29.24 )。 )。 |
| 62. | 选择Based on Value(基于该值)单选按钮(图T29.24 )。 )。 |
| 63. | 点击OK来关闭Formatting(格式化)窗口(图T29.25)。标准化后,该柱状图看上去类似于图T29.30,右边;如果不选择标准化,该柱状图看上去类似于图T29.29。 |

Figure T29.25 Clicking OK to accept the formatting changes.
通过在 CD20-positive群体上创建一个标识,来查看IgD/IgM双阴性和双阳性群体中CD20表达的不同。
| 65. | 在相关联的弹出窗口中选择Create marker(创建标识)(图T29.26)。 |
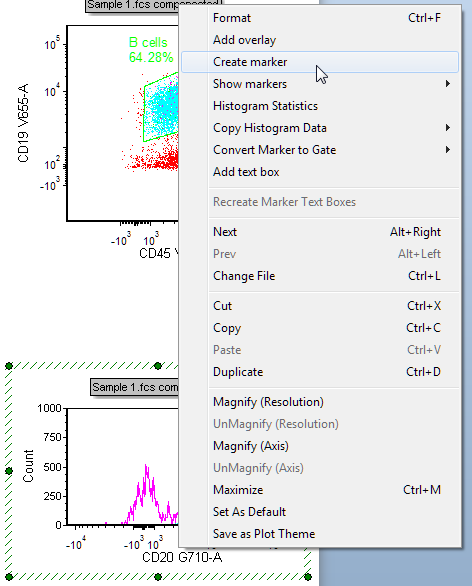
Figure T29.26 Right-clicking on the histogram to add a marker
| 66. | 在阳性群体峰值的左边点击鼠标左键,并按住不放(图T29.27)。 |
| 67. | 移动光标,跨越该阳性峰(图T29.27 )。 )。 |
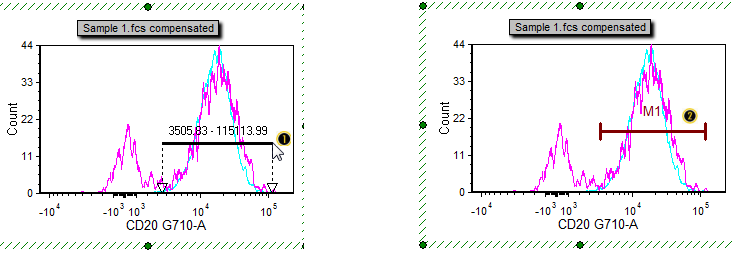 Figure T29.27 Creating a marker |
| 68. | 然后,松开鼠标。现在,标识("M1”)已经被添加到绘图中了(图T29.27 )。 )。 |
| 69. | 选择File(文件)标签→Save As(保存为),将该版面保存为 linked(相链接) (第二个单选按钮,展示于(图4.2),或者简单的按下Ctrl + S键,在您已经将该版面保存为linked(相链接)Save Point #1 or #2情况下。在该章节之后的时间,您可以点击该页面顶端的Save Point #3来回到这一步骤. |

Save Point #3 (Step 69, end of this section)
我们现在已创建了一个带有二维绘图、柱状图、门、象限和标识的版面。下一节,我们将添加summary statistics(概要统计)到版面中。


