Formatting Pie Charts

Contents
Pie Charts in FCS Express are fully formattable. In addition to many of the formatting options shared by all plots (border, size, background, titles, and legend), special formatting options are accessible from the Overlays category. To access these special options:
| • | Select the Pie Chart and use the Format tab→Plot Options→Overlays command (Figure 11.21), or |
| • | Right-click on the Pie Chart, select Format from the pop-up menu, and choose the Overlays category. |
Special formatting options for Pie Charts are pictured below and include:
| • | Plotting additional data as a Ring Parameter ( |
| • | Explode Parameter for exploding individual sectors (slices) for emphasis ( |
| • | Color Parameter for sector (slice) colors ( |
| • | Shadow ( |
| • | Displaying of Pie Chart as filled pie (default) or "donut" ( |
| • | Caption Style ( |

Figure 11.20 Special formatting options for Pie Charts
The formatting options are described in the table below.
Option |
Explanation |
|---|---|
Value Parameter |
The parameter (column) from the Custom Data Grid displayed as value of the sector (slice). |
Name Parameter |
The parameter (column) from the Custom Data Grid displayed as name of the sector (slice). |
Ring Parameter |
The parameter (column) from the Custom Data Grid displayed as sector values of the Ring. See below for more information on displaying additional data as a Ring on Pie Charts. |
Explode Parameter |
The parameter (column) from the Custom Data Grid from which the Explode rule derives. A sector (slice) will explode away from the pie for emphasis (e.g., the yellow sector shown below) if its value meets the criterion defined by the Explode rule. See below for more information on how to define am Explode rule. |
Color Parameter |
The parameter (column) from the Custom Data Grid defining the display color the sector (slice). See the Pie Charts tutorial for details. |
Gate |
The range gate defined on the Custom Data Grid that is applied to the Pie Chart. |
Show Shadow |
Whether a shadow behind the Pie Chart is shown. |
Color Scheme |
Any of twenty preset coloring schemes which can be applied to the Pie Chart. |
Show as "donut" chart |
Whether the Pie Chart is shown with a hole in the center. |
Hole size |
If the Pie Chart is shown as "donut" ( |
Caption Style |
The Name, Value, percentage of the pie (note: "percentage of the pie" differs from "percent gated") or any combination thereof can be shown as text directly beside each sector of the pie or ring. Clicking directly on the Caption also allows for direct editing. |
Legend Title |
Text title for the Name parameters listed in the Legend. |
Change data file during Next/Prev/Batch |
Whether the Pie Chart changes during batch processing or in response to a Next/Previous command. It is generally recommended to leave this unchecked (default), as the Pie Chart will update automatically as the data to which it refers is changed. |
Visible |
Whether the Pie Chart is visible within the object. |
To add Ring values as additional data at the periphery of the pie or Exploding for emphasis to a Pie Chart, these values must be entered into designated columns in the Custom Data Grid. To access the Custom Data Grid if it has been deleted from the layout, select the View tab→Navigators→Data Navigator command, drag and drop the "New custom data" item onto the layout, choose Data Grid from the Select Plot Types dialog, and click OK.
To define values for the Ring:
| 1. | Add a new column to the Data Grid, if no empty columns exist |
| 2. | Optional: rename the empty column "ring" |
| 3. | Enter the value of the Ring for each row (each row corresponds to an individual bar). This value may be freetext or a custom token. |
| 4. | Choose the appropriate Custom Data Grid column for the Ring Parameter (Figure 11 above, |
An example of a Pie Chart with additional Ring values (plotted at the periphery of the Pie) and its associated Custom Data grid is shown in Figure 11 below.
| 1. | Add a new column to the Data Grid, if no empty columns exist |
| 2. | Optional: rename the empty column "explode" |
| 3. | enter the value of the rule for each row (each row corresponds to an individual bar). The rule must be a formula evaluating to "TRUE" or "FALSE"; if "TRUE," the sector (slice) will explode away from the pie. An example of an Explode rule containing a token is shown below: |
=if Statistic: % of Gated Cells for Density Plot, Gate 3 > 9 then "true" else "false"
| 4. | Choose the appropriate Custom Data Grid column for the Explode Parameter (Figure 11 below, |
An example of a Pie Chart with the Explode option and its associated Custom Data grid is shown in Figure 11 below.

Figure 11.21 Pie Chart and associated Custom Data Grid with Ring and Explode formatting options
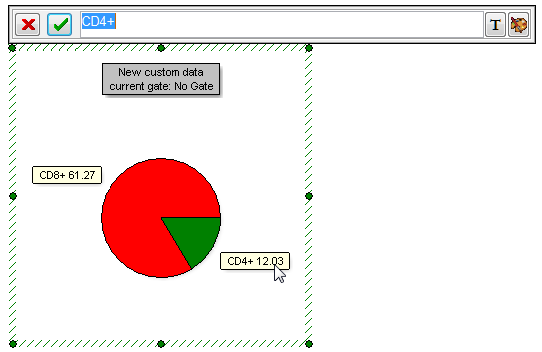
To edit Captions directly on a Pie Chart:
| 1. | Click on the Caption. |
| 2. | Enter freetext or tokens (using the |
| 3. | Click the green check mark in the Caption editor bar or hit Enter on the keyboard to accept the change. In the example below, the Caption for the green sector (slice) has been amended with the text "CD4+". |